Pottery Barn 2008 Annual Report Download - page 130
Download and view the complete annual report
Please find page 130 of the 2008 Pottery Barn annual report below. You can navigate through the pages in the report by either clicking on the pages listed below, or by using the keyword search tool below to find specific information within the annual report.-
 1
1 -
2
-
3
-
4
-
5
-
6
-
7
-
8
-
9
-
10
-
11
-
12
-
13
-
14
-
15
-
16
-
17
-
18
-
19
-
20
-
21
-
22
-
23
-
24
-
25
-
26
-
27
-
28
-
29
-
30
-
31
-
32
-
33
-
34
-
35
-
36
-
37
-
38
-
39
-
40
-
41
-
42
-
43
-
44
-
45
-
46
-
47
-
48
-
49
-
50
-
51
-
52
-
53
-
54
-
55
-
56
-
57
-
58
-
59
-
60
-
61
-
62
-
63
-
64
-
65
-
66
-
67
-
68
-
69
-
70
-
71
-
72
-
73
-
74
-
75
-
76
-
77
-
78
-
79
-
80
-
81
-
82
-
83
-
84
-
85
-
86
-
87
-
88
-
89
-
90
-
91
-
92
-
93
-
94
-
95
-
96
-
97
-
98
-
99
-
100
-
101
-
102
-
103
-
104
-
105
-
106
-
107
-
108
-
109
-
110
-
111
-
112
-
113
-
114
-
115
-
116
-
117
-
118
-
119
-
 120
120 -
 121
121 -
 122
122 -
 123
123 -
 124
124 -
 125
125 -
 126
126 -
 127
127 -
 128
128 -
 129
129 -
 130
130 -
 131
131 -
 132
132 -
 133
133 -
 134
134 -
 135
135 -
 136
136 -
 137
137 -
 138
138 -
 139
139 -
 140
140 -
141
-
142
-
143
-
144
-
145
-
146
-
147
-
148
-
149
-
150
-
151
-
152
-
153
-
154
-
155
-
156
-
157
-
158
-
159
-
160
-
161
-
162
-
163
-
164
-
165
-
166
-
167
-
168
 |
 |

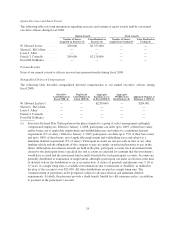
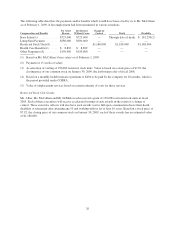
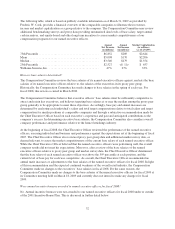
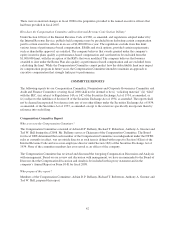
The following table, which is based on publicly available information as of March 31, 2009 as provided by
Frederic W. Cook, provides a financial overview of the comparable companies to illustrate their revenues,
income and market capitalization as a group relative to the company. The Compensation Committee may review
additional benchmarking surveys and proxy data providing summarized data levels of base salary, target annual
cash incentives, and equity-based and other long-term incentives to assess market competitiveness of our
compensation programs for our named executive officers.
Annual
Net Revenue
(in millions)
Annual
Net Income
(in millions)
Market Capitalization
(in millions)
(as of 1/31/09)
75th Percentile ......................................... $6,852 $289 $2,644
Mean ................................................ $5,008 $170 $2,206
Median ............................................... $3,540 $179 $1,554
25th Percentile ......................................... $2,527 <$ 11> $ 657
Williams-Sonoma, Inc. .................................. 47% 27% 33%
How are base salaries determined?
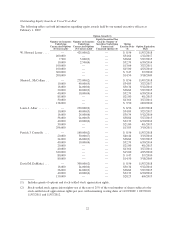
The Compensation Committee reviews the base salaries of its named executive officers against, and sets the base
salaries of its named executive officers relative to, the salaries of the executives in its proxy peer group.
Historically, the Compensation Committee has made changes to base salaries in the spring of each year. For
fiscal 2008, this review occurred in March 2008.
The Compensation Committee believes that executive officers’ base salaries must be sufficiently competitive to
attract and retain key executives, and believes targeting base salaries at or near the median among the proxy peer
group generally to be appropriate to meet these objectives. Accordingly, base pay and annual increases are
determined by analyzing each individual’s salary and total target compensation relative to total salary and target
compensation for similar positions at comparable companies and through a subjective recommendation made by
the Chief Executive Officer based on each executive’s experience and past and anticipated contributions to the
company’s success. In determining executive base salaries, the Compensation Committee also considers overall
company performance and performance relative to the home furnishings industry.
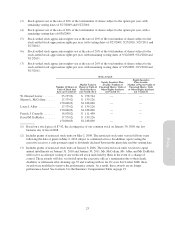
At the beginning of fiscal 2008, the Chief Executive Officer reviewed the performance of the named executive
officers, assessing individual and business unit performance against the expectations set at the beginning of fiscal
2007. The Chief Executive Officer also reviewed proxy peer group data and additional market survey data, as
deemed relevant, to assess the market competitiveness of the current base salary of each named executive officer.
While the Chief Executive Officer believed that the named executive officers were performing well, the overall
company results did not meet his expectations. Moreover, after a review of the base salaries of the named
executive officers relative to proxy peer group and market survey data, the Chief Executive Officer determined
that the base salary of each named executive officer was above the 50th percentile at each position, and the
current level of base pay for each was competitive. As a result, the Chief Executive Officer recommended no
annual merit increases or adjustments to the base salaries of the named executive officers for fiscal 2008. In light
of this recommendation and the expected continued weakness of the overall retail industry, the Compensation
Committee made no changes to the executives’ base salaries in fiscal 2008. For the same reasons, the
Compensation Committee made no changes to the base salaries of the named executive officers for fiscal 2009 at
its Committee meeting held on March 18, 2009 and currently does not intend to make any changes for fiscal
2009.
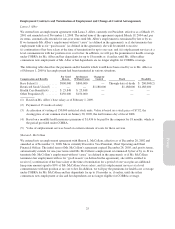
Were annual incentive bonuses awarded to named executive officers for fiscal 2008?
No. Annual incentive bonuses were not awarded to our named executive officers for fiscal 2008 under or outside
of the 2001 Incentive Bonus Plan. This is discussed in further detail below.
32