Pottery Barn 2008 Annual Report Download - page 42
Download and view the complete annual report
Please find page 42 of the 2008 Pottery Barn annual report below. You can navigate through the pages in the report by either clicking on the pages listed below, or by using the keyword search tool below to find specific information within the annual report.-
 1
1 -
2
-
3
-
4
-
5
-
6
-
7
-
8
-
9
-
10
-
11
-
12
-
13
-
14
-
15
-
16
-
17
-
18
-
19
-
20
-
21
-
22
-
23
-
24
-
25
-
26
-
27
-
28
-
29
-
30
-
31
-
 32
32 -
 33
33 -
 34
34 -
 35
35 -
 36
36 -
 37
37 -
 38
38 -
 39
39 -
 40
40 -
 41
41 -
 42
42 -
 43
43 -
 44
44 -
 45
45 -
 46
46 -
 47
47 -
 48
48 -
 49
49 -
 50
50 -
 51
51 -
 52
52 -
53
-
54
-
55
-
56
-
57
-
58
-
59
-
60
-
61
-
62
-
63
-
64
-
65
-
66
-
67
-
68
-
69
-
70
-
71
-
72
-
73
-
74
-
75
-
76
-
77
-
78
-
79
-
80
-
81
-
82
-
83
-
84
-
85
-
86
-
87
-
88
-
89
-
90
-
91
-
92
-
93
-
94
-
95
-
96
-
97
-
98
-
99
-
100
-
101
-
102
-
103
-
104
-
105
-
106
-
107
-
108
-
109
-
110
-
111
-
112
-
113
-
114
-
115
-
116
-
117
-
118
-
119
-
120
-
121
-
122
-
123
-
124
-
125
-
126
-
127
-
128
-
129
-
130
-
131
-
132
-
133
-
134
-
135
-
136
-
137
-
138
-
139
-
140
-
141
-
142
-
143
-
144
-
145
-
146
-
147
-
148
-
149
-
150
-
151
-
152
-
153
-
154
-
155
-
156
-
157
-
158
-
159
-
160
-
161
-
162
-
163
-
164
-
165
-
166
-
167
-
168
 |
 |
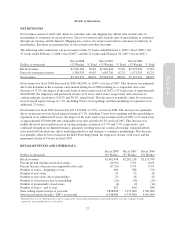
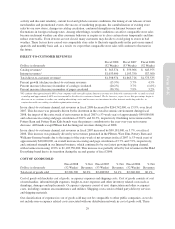
costs, which include distribution network employment, third party warehouse management and other
distribution-related administrative expenses, are recorded in selling, general and administrative expenses.
Within our reportable segments, the direct-to-customer channel does not incur freight-to-store or store occupancy
expenses, and typically operates with lower markdowns and inventory shrinkage than the retail channel.
However, the direct-to-customer channel incurs higher customer shipping and damage and replacement costs
than the retail channel.
Fiscal 2008 vs. Fiscal 2007
Cost of goods sold decreased by $182,663,000, or 7.6%, in fiscal 2008 compared to fiscal 2007. Including
expense of approximately $2,390,000 from lease termination related costs associated with our infrastructure cost
reduction program, cost of goods sold as a percentage of net revenues increased to 66.2% in fiscal 2008 from
61.1% in fiscal 2007. This increase as a percentage of net revenues was driven by the deleverage of fixed
occupancy expenses primarily due to declining sales, an increase in cost of merchandise (including the impact of
greater markdowns) and an increase in inventory related reserves of approximately $11,172,000 partially offset
by favorable replacement and damages expense.
In the retail channel, cost of goods sold as a percentage of retail net revenues increased 670 basis points during
fiscal 2008 compared to fiscal 2007. This increase as a percentage of net revenues was primarily driven by the
deleverage of fixed occupancy expenses due to declining sales, an increase in cost of merchandise (including the
impact of greater markdowns) and an increase in inventory related reserves, partially offset by favorable
replacement and damages expense.
In the direct-to-customer channel, cost of goods sold as a percentage of direct-to-customer net revenues increased
by 180 basis points during fiscal 2008 compared to fiscal 2007. This increase as a percentage of net revenues was
primarily driven by an increase in cost of merchandise (including the impact of greater markdowns), an increase
in inventory related reserves and the deleverage of fixed occupancy expenses due to declining sales, partially
offset by favorable replacement and damages expense.
Fiscal 2007 vs. Fiscal 2006
Cost of goods sold increased by $168,737,000, or 7.5%, in fiscal 2007 over fiscal 2006. Cost of goods sold as a
percentage of net revenues increased to 61.1% in fiscal 2007 from 60.1% in fiscal 2006. This 100 basis point
increase as a percentage of net revenues was primarily driven by increased markdowns, higher cost of
merchandise sold due to increased raw material costs and higher inventory-related costs, including costs
associated with the start-up of a new returns processing operation, partially offset by fixed occupancy expense
leverage generated by incremental net revenues during the additional week in fiscal 2007 and the elimination of
cost of goods sold associated with the Hold Everything brand, including expense associated with the Hold
Everything transition.
In the retail channel, cost of goods sold as a percentage of retail net revenues increased 140 basis points during
fiscal 2007 compared to fiscal 2006. This was primarily driven by increased markdowns, higher cost of
merchandise sold due to increasing raw material costs and higher inventory-related costs. This increase was
further driven by increased occupancy costs primarily resulting from the retail rollout of our emerging brands.
This was partially offset by the elimination of cost of goods sold associated with the Hold Everything brand,
including expense associated with the Hold Everything transition, and the leverage on fixed occupancy expenses
provided by the incremental net revenues generated during the additional week in fiscal 2007.
In the direct-to-customer channel, cost of goods sold as a percentage of direct-to-customer net revenues increased
by 30 basis points during fiscal 2007 compared to fiscal 2006. This was primarily driven by increased
markdowns, higher cost of merchandise sold due to increasing raw material costs and higher inventory-related
costs, including costs associated with the start-up of a new returns processing operation. This was partially offset
by the elimination of cost of goods sold associated with the Hold Everything brand.
30