Pep Boys 2012 Annual Report Download - page 92
Download and view the complete annual report
Please find page 92 of the 2012 Pep Boys annual report below. You can navigate through the pages in the report by either clicking on the pages listed below, or by using the keyword search tool below to find specific information within the annual report.-
 1
1 -
2
-
3
-
4
-
5
-
6
-
7
-
8
-
9
-
10
-
11
-
12
-
13
-
14
-
15
-
16
-
17
-
18
-
19
-
20
-
21
-
22
-
23
-
24
-
25
-
26
-
27
-
28
-
29
-
30
-
31
-
32
-
33
-
34
-
35
-
36
-
37
-
38
-
39
-
40
-
41
-
42
-
43
-
44
-
45
-
46
-
47
-
48
-
49
-
50
-
51
-
52
-
53
-
54
-
55
-
56
-
57
-
58
-
59
-
60
-
61
-
62
-
63
-
64
-
65
-
66
-
67
-
68
-
69
-
70
-
71
-
72
-
73
-
74
-
75
-
76
-
77
-
78
-
79
-
80
-
81
-
 82
82 -
 83
83 -
 84
84 -
 85
85 -
 86
86 -
 87
87 -
 88
88 -
 89
89 -
 90
90 -
 91
91 -
 92
92 -
 93
93 -
 94
94 -
 95
95 -
 96
96 -
 97
97 -
 98
98 -
 99
99 -
 100
100 -
 101
101 -
 102
102 -
103
-
104
-
105
-
106
-
107
-
108
-
109
-
110
-
111
-
112
-
113
-
114
-
115
-
116
-
117
-
118
-
119
-
120
-
121
-
122
-
123
-
124
-
125
-
126
-
127
-
128
-
129
-
130
-
131
 |
 |

THE PEP BOYS—MANNY, MOE & JACK AND SUBSIDIARIES
NOTES TO CONSOLIDATED FINANCIAL STATEMENTS (Continued)
Years ended February 2, 2013, January 28, 2012 and January 29, 2011
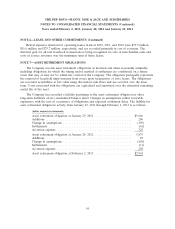
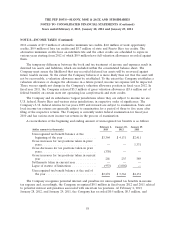
NOTE 5—DEBT AND FINANCING ARRANGEMENTS (Continued)
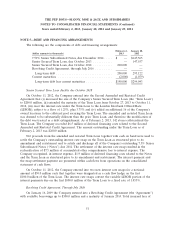
The annual maturities under the Senior Secured Term Loan, due October 2018, for the next five
fiscal years are:
(dollar amounts in thousands) Long-Term
Fiscal Year Debt
2013 ................................................... $ 2,000
2014 ................................................... 2,000
2015 ................................................... 2,000
2016 ................................................... 2,000
2017 ................................................... 2,000
Thereafter ............................................... 190,000
Total ................................................... $200,000
Interest rates that are currently available to the Company for issuance of debt with similar terms
and remaining maturities are used to estimate fair value for debt obligations and are considered a
level 2 measure under the fair value hierarchy. The estimated fair value of long-term debt including
current maturities was $203.5 million and $293.6 million as of February 2, 2013 and January 28, 2012,
respectively
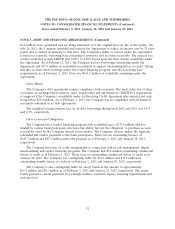
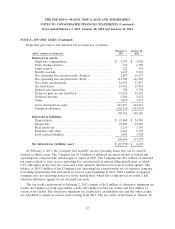
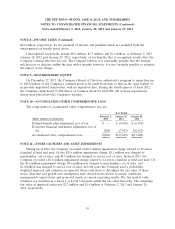
NOTE 6—LEASE AND OTHER COMMITMENTS
In fiscal 2010, the Company sold one property to an unrelated third party. Net proceeds from this
sale were $1.6 million. Concurrent with this sale, the Company entered into an agreement to lease the
property back from the purchaser over a minimum lease term of 15 years. The Company classified this
lease as an operating lease. The Company actively uses this property and considers the lease as a
normal leaseback. The Company recorded a deferred gain of $0.4 million.
In connection with the three acquisitions that occurred during fiscal 2011, the Company assumed
additional lease obligations totaling $120.2 million over an average of 14 years.
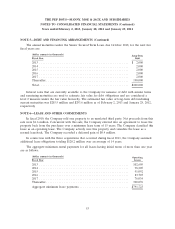
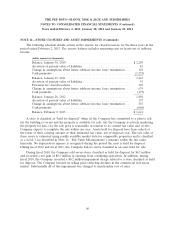
The aggregate minimum rental payments for all leases having initial terms of more than one year
are as follows:
(dollar amounts in thousands) Operating
Fiscal Year Leases
2013 ................................................... 102,609
2014 ................................................... 98,205
2015 ................................................... 91,092
2016 ................................................... 83,707
2017 ................................................... 76,034
Thereafter ............................................... 340,076
Aggregate minimum lease payments ............................ $791,723
53