Pep Boys 2012 Annual Report Download - page 61
Download and view the complete annual report
Please find page 61 of the 2012 Pep Boys annual report below. You can navigate through the pages in the report by either clicking on the pages listed below, or by using the keyword search tool below to find specific information within the annual report.-
 1
1 -
2
-
3
-
4
-
5
-
6
-
7
-
8
-
9
-
10
-
11
-
12
-
13
-
14
-
15
-
16
-
17
-
18
-
19
-
20
-
21
-
22
-
23
-
24
-
25
-
26
-
27
-
28
-
29
-
30
-
31
-
32
-
33
-
34
-
35
-
36
-
37
-
38
-
39
-
40
-
41
-
42
-
43
-
44
-
45
-
46
-
47
-
48
-
49
-
50
-
 51
51 -
 52
52 -
 53
53 -
 54
54 -
 55
55 -
 56
56 -
 57
57 -
 58
58 -
 59
59 -
 60
60 -
 61
61 -
 62
62 -
 63
63 -
 64
64 -
 65
65 -
 66
66 -
 67
67 -
 68
68 -
 69
69 -
 70
70 -
 71
71 -
72
-
73
-
74
-
75
-
76
-
77
-
78
-
79
-
80
-
81
-
82
-
83
-
84
-
85
-
86
-
87
-
88
-
89
-
90
-
91
-
92
-
93
-
94
-
95
-
96
-
97
-
98
-
99
-
100
-
101
-
102
-
103
-
104
-
105
-
106
-
107
-
108
-
109
-
110
-
111
-
112
-
113
-
114
-
115
-
116
-
117
-
118
-
119
-
120
-
121
-
122
-
123
-
124
-
125
-
126
-
127
-
128
-
129
-
130
-
131
 |
 |
merchandise sales decline. Total comparable store sales decreased primarily due to lower customer
counts partially offset by an increase in the average transaction amount per customer. While our total
revenues were favorably impacted by the opening of new stores, a new store is not added to our
comparable store sales until it reaches its 13th month of operation. The additional week of fiscal 2012
and non-comparable stores contributed an additional $68.2 million of total revenue in fiscal 2012 as
compared to the prior year.
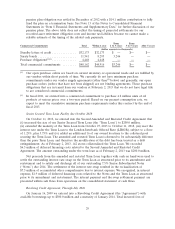
Total merchandise sales increased 0.1%, or $1.2 million, to $1,643.9 million for fiscal 2012,
compared to $1,642.8 million for fiscal 2011. Excluding the fifty-third week in 2012, comparable
merchandise sales decreased by 2.9%, or $46.6 million. The decrease in comparable store merchandise
sales was driven primarily by lower comparable store customer counts partially offset by a higher
average transaction amount per customer and was comprised of a 4.4% decline in merchandise sold
through our retail business and a 0.3% decrease in merchandise sold through our service business
(resulting primarily from lower tire sales). The fifty third week and our non-comparable stores
contributed an additional $47.8 million of merchandise sales.
Total service revenue increased 6.2%, or $25.9 million, to $446.8 million for fiscal 2012 from
$420.9 million for fiscal 2011. Excluding the fifty-third week in 2012, comparable service revenue
increased by 1.3%, or $5.6 million. The increase in comparable store service revenue was due to higher
customer counts partially offset by a decrease in the average transaction amount per customer. The
fifty third week and our non-comparable stores contributed an additional $20.4 million of service
revenue.
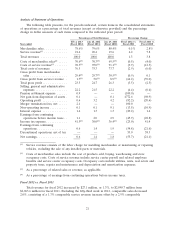
In our retail business, we believe that the difficult macroeconomic conditions continue to impact
our customers and led to the comparable store customer counts decline, while we experienced an
increase in the average transaction amount per customer resulting from higher selling prices. In our
service business, we believe that we experienced an increase in comparable store customer counts due
to the strength of our service offering and our promotion of oil changes. However, this shift in service
sales mix towards lower cost oil changes reduced the average transaction amount per service customer.
Total gross profit decreased by $18.0 million, or 3.5%, to $491.5 million for fiscal 2012 from
$509.5 million for fiscal 2011. Total gross profit margin decreased to 23.5% for fiscal 2012 from 24.7%
for fiscal 2011. Total gross profit for fiscal 2012 and 2011 included an asset impairment charge of
$10.6 million and $1.6 million, respectively. In addition, fiscal 2011 included a $1.1 million reduction in
the reserve for excess inventory. Excluding these items from both years, total gross profit margin
decreased by 70 basis points to 24.0% for fiscal 2012 from 24.7% for fiscal 2011. This decrease in total
gross profit margin was primarily due to higher payroll and related expenses as a percent of total sales.
In addition, the new Service & Tire Centers have a higher concentration of their sales in lower margin
tires and oil changes, are leased facilities and are subject to a full payroll burden from their first day of
operation. The Service & Tire Centers (exclusive of the impairment charge) reduced total margins by
180 basis points and 100 basis points in 2012 and 2011, respectively. While the new Service & Tire
Centers have had a negative impact on total gross profit margin, these Service & Tire Centers
positively contributed to total gross profit in both years.
Gross profit from merchandise sales decreased by $4.5 million, or 0.9%, to $484.0 million for fiscal
2012 from $488.4 million for fiscal 2011. Gross profit margin from merchandise sales decreased to
29.4% for fiscal 2012 from 29.7% in fiscal 2011. Gross profit from merchandise sales in fiscal 2012 and
2011 included an asset impairment charge of $5.1 million and $0.6 million, respectively. In addition,
fiscal 2011 included a $1.1 million reduction in the reserve for excess inventory. Excluding these items
from both years, gross profit margin from merchandise sales remained relatively flat year over year at
29.7%.
Gross profit from service revenue decreased by $13.5 million, or 64.0%, to $7.5 million for fiscal
2012 from $21.1 million for fiscal 2011. Gross profit margin from service revenue decreased to 1.7% for
22