Pep Boys 2012 Annual Report Download - page 113
Download and view the complete annual report
Please find page 113 of the 2012 Pep Boys annual report below. You can navigate through the pages in the report by either clicking on the pages listed below, or by using the keyword search tool below to find specific information within the annual report.-
 1
1 -
2
-
3
-
4
-
5
-
6
-
7
-
8
-
9
-
10
-
11
-
12
-
13
-
14
-
15
-
16
-
17
-
18
-
19
-
20
-
21
-
22
-
23
-
24
-
25
-
26
-
27
-
28
-
29
-
30
-
31
-
32
-
33
-
34
-
35
-
36
-
37
-
38
-
39
-
40
-
41
-
42
-
43
-
44
-
45
-
46
-
47
-
48
-
49
-
50
-
51
-
52
-
53
-
54
-
55
-
56
-
57
-
58
-
59
-
60
-
61
-
62
-
63
-
64
-
65
-
66
-
67
-
68
-
69
-
70
-
71
-
72
-
73
-
74
-
75
-
76
-
77
-
78
-
79
-
80
-
81
-
82
-
83
-
84
-
85
-
86
-
87
-
88
-
89
-
90
-
91
-
92
-
93
-
94
-
95
-
96
-
97
-
98
-
99
-
100
-
101
-
102
-
 103
103 -
 104
104 -
 105
105 -
 106
106 -
 107
107 -
 108
108 -
 109
109 -
 110
110 -
 111
111 -
 112
112 -
 113
113 -
 114
114 -
 115
115 -
 116
116 -
 117
117 -
 118
118 -
 119
119 -
 120
120 -
 121
121 -
 122
122 -
 123
123 -
124
-
125
-
126
-
127
-
128
-
129
-
130
-
131
 |
 |

THE PEP BOYS—MANNY, MOE & JACK AND SUBSIDIARIES
NOTES TO CONSOLIDATED FINANCIAL STATEMENTS (Continued)
Years ended February 2, 2013, January 28, 2012 and January 29, 2011
NOTE 17—LEGAL MATTERS (Continued)
could have a material adverse effect on the Company’s results of operations in the period(s) during
which the underlying matters are resolved.
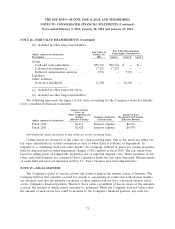
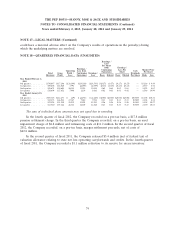
NOTE 18—QUARTERLY FINANCIAL DATA (UNAUDITED)
Earnings /
Loss
Per Share
from Earnings /
Earnings / Continuing Loss Per Market Price
Operating Loss from Cash
Operations Share Per Share
Total Gross Profit / Continuing Earnings / Dividends
Revenues Profit Loss Operations Loss Basic Diluted Basic Diluted Per Share High Low
Year Ended February 2,
2013
4th quarter ......... $530,847 $117,206 $(16,394) $(14,320) $(14,543) $(0.27) (0.27) (0.27) (0.27) — $11.16 $ 9.48
3rd quarter ......... 509,608 116,040 3,791 (6,695) (6,759) (0.13) (0.13) (0.13) (0.13) — 10.57 8.76
2nd quarter ......... 525,671 130,601 16,315 33,034 33,048 0.62 0.61 0.62 0.61 — 14.93 8.67
1st quarter ......... 524,604 127,652 7,940 1,134 1,062 0.02 0.02 0.02 0.02 — 15.46 14.90
Year Ended January 28,
2012
4th quarter ......... $505,318 $112,273 $ (29) $ (4,191) $ (4,420) $(0.08) $(0.08) $(0.08) $(0.08) $0.0300 $12.08 $10.21
3rd quarter ......... 522,173 126,921 17,347 7,022 7,011 0.13 0.13 0.13 0.13 0.0300 12.04 8.18
2nd quarter ......... 522,594 135,210 21,939 13,891 13,943 0.26 0.26 0.26 0.26 0.0300 14.28 10.27
1st quarter ......... 513,540 135,122 26,311 12,405 12,368 0.23 0.23 0.23 0.23 0.0300 14.70 10.53
The sum of individual share amounts may not equal due to rounding.
In the fourth quarter of fiscal 2012, the Company recorded on a pre-tax basis, a $17.8 million
pension settlement charge. In the third quarter the Company recorded, on a pre-tax basis, an asset
impairment charge of $8.8 million and refinancing costs of $11.2 million. In the second quarter of fiscal
2012, the Company recorded, on a pre-tax basis, merger settlement proceeds, net of costs of
$42.8 million.
In the second quarter of fiscal 2011, the Company released $3.4 million (net of federal tax) of
valuation allowance relating to state net loss operating carryforwards and credits. In the fourth quarter
of fiscal 2011, the Company recorded a $1.1 million reduction to its reserve for excess inventory.
74