Pep Boys 2012 Annual Report Download - page 27
Download and view the complete annual report
Please find page 27 of the 2012 Pep Boys annual report below. You can navigate through the pages in the report by either clicking on the pages listed below, or by using the keyword search tool below to find specific information within the annual report.-
 1
1 -
2
-
3
-
4
-
5
-
6
-
7
-
8
-
9
-
10
-
11
-
12
-
13
-
14
-
15
-
16
-
 17
17 -
 18
18 -
 19
19 -
 20
20 -
 21
21 -
 22
22 -
 23
23 -
 24
24 -
 25
25 -
 26
26 -
 27
27 -
 28
28 -
 29
29 -
 30
30 -
 31
31 -
 32
32 -
 33
33 -
 34
34 -
 35
35 -
 36
36 -
 37
37 -
38
-
39
-
40
-
41
-
42
-
43
-
44
-
45
-
46
-
47
-
48
-
49
-
50
-
51
-
52
-
53
-
54
-
55
-
56
-
57
-
58
-
59
-
60
-
61
-
62
-
63
-
64
-
65
-
66
-
67
-
68
-
69
-
70
-
71
-
72
-
73
-
74
-
75
-
76
-
77
-
78
-
79
-
80
-
81
-
82
-
83
-
84
-
85
-
86
-
87
-
88
-
89
-
90
-
91
-
92
-
93
-
94
-
95
-
96
-
97
-
98
-
99
-
100
-
101
-
102
-
103
-
104
-
105
-
106
-
107
-
108
-
109
-
110
-
111
-
112
-
113
-
114
-
115
-
116
-
117
-
118
-
119
-
120
-
121
-
122
-
123
-
124
-
125
-
126
-
127
-
128
-
129
-
130
-
131
 |
 |

23
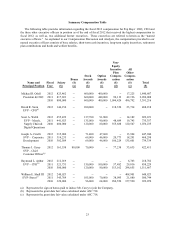
Summary Compensation Table
The following table provides information regarding the fiscal 2012compensation for Pep Boys’ CEO, CFO and
the three other executive officers in position as of the end of fiscal 2012 that received the highest compensation in
fiscal 2012, as well as, two additional former executives. These executives are referred to herein as the “named
executive officers.” As explained in our Compensation Discussion and Analysis, the compensation provided to our
named executive officers consistsof base salaries, short-term cash incentives, long-term equity incentives, retirement
plan contributions and heath and welfare benefits.
Name and
Principal Position
Fiscal
Year
Salary
($)
Bonus
($)
(a)
Stock
Awards
($)
(b)
Option
Awards
($)
(c)
Non-
Equity
Incentive
Plan
Compen-
sation
($)
(d)
All
Other
Compen-
sation
($)
(e)
Total
($)
Michael R. Odell 2012 823,462 -- 600,000 400,000 -- 17,225 1,840,687
President & CEO 2011 817,693 -- 660,000 440,000 90,119 42,196 2,050,008
2010 800,000 -- 600,000 400,000 1,094,424 496,792 3,391,216
David R. Stern 2012 146,154 -- 200,000 -- 118,350 23,714 488,218
EVP –CFO(f)
Scott A. Webb 2012 455,439 -- 137,700 91,800 -- 14,182 699,221
EVP –Merch, 2011 441,923 -- 135,000 90,000 48,689 19,745 735,357
Supply Chain &
Digital Operations
2010 400,000 -- 120,000 80,000 355,688 120,547 1,076,235
Joseph A. Cirelli 2012 315,000 -- 71,400 47,600 -- 13,944 447,944
SVP –Corporate 2011 314,235 -- 69,000 46,000 20,773 18,291 468,298
Development 2010 302,509 -- 69,000 46,000 186,229 135,601 739,339
Thomas J. Carey 2012 161,538 80,000 70,000 -- 77,238 33,635 422,411
SVP –Chief
Customer Officer(g)
Raymond L. Arthur 2012 212,019 -- -- -- -- 6,763 218,782
EVP –CFO(h) 2011 521,731 -- 150,000 100,000 57,482 29,016 858,229
2010 500,000 -- 120,000 80,000 513,012 298,655 1,511,667
William E. Shull III 2012 240,023 -- -- -- -- 408,901 648,923
EVP–Stores(i) 2011 345,769 -- 105,000 70,000 38,095 21,880 580,744
2010 320,000 -- 96,000 64,000 284,550 157,520 922,070
(a) Represents the sign on bonus paid to induce Mr. Carey to join the Company.
(b) Represents the grant date fair value calculated under ASC 718.
(c) Represents the grant date fair value calculated under ASC 718.