Pep Boys 2012 Annual Report Download - page 76
Download and view the complete annual report
Please find page 76 of the 2012 Pep Boys annual report below. You can navigate through the pages in the report by either clicking on the pages listed below, or by using the keyword search tool below to find specific information within the annual report.-
 1
1 -
2
-
3
-
4
-
5
-
6
-
7
-
8
-
9
-
10
-
11
-
12
-
13
-
14
-
15
-
16
-
17
-
18
-
19
-
20
-
21
-
22
-
23
-
24
-
25
-
26
-
27
-
28
-
29
-
30
-
31
-
32
-
33
-
34
-
35
-
36
-
37
-
38
-
39
-
40
-
41
-
42
-
43
-
44
-
45
-
46
-
47
-
48
-
49
-
50
-
51
-
52
-
53
-
54
-
55
-
56
-
57
-
58
-
59
-
60
-
61
-
62
-
63
-
64
-
65
-
 66
66 -
 67
67 -
 68
68 -
 69
69 -
 70
70 -
 71
71 -
 72
72 -
 73
73 -
 74
74 -
 75
75 -
 76
76 -
 77
77 -
 78
78 -
 79
79 -
 80
80 -
 81
81 -
 82
82 -
 83
83 -
 84
84 -
 85
85 -
 86
86 -
87
-
88
-
89
-
90
-
91
-
92
-
93
-
94
-
95
-
96
-
97
-
98
-
99
-
100
-
101
-
102
-
103
-
104
-
105
-
106
-
107
-
108
-
109
-
110
-
111
-
112
-
113
-
114
-
115
-
116
-
117
-
118
-
119
-
120
-
121
-
122
-
123
-
124
-
125
-
126
-
127
-
128
-
129
-
130
-
131
 |
 |

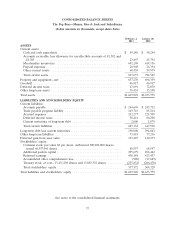
CONSOLIDATED BALANCE SHEETS
The Pep Boys—Manny, Moe & Jack and Subsidiaries
(dollar amounts in thousands, except share data)
February 2, January 28,
2013 2012
ASSETS
Current assets:
Cash and cash equivalents .................................... $ 59,186 $ 58,244
Accounts receivable, less allowance for uncollectible accounts of $1,302 and
$1,303 ................................................. 23,897 25,792
Merchandise inventories ..................................... 641,208 614,136
Prepaid expenses ........................................... 28,908 26,394
Other current assets ........................................ 60,438 59,979
Total current assets ......................................... 813,637 784,545
Property and equipment—net ................................... 657,270 696,339
Goodwill .................................................. 46,917 46,917
Deferred income taxes ........................................ 47,691 72,870
Other long-term assets ........................................ 38,434 33,108
Total assets ................................................. $1,603,949 $1,633,779
LIABILITIES AND STOCKHOLDERS’ EQUITY
Current liabilities:
Accounts payable .......................................... $ 244,696 $ 243,712
Trade payable program liability ................................ 149,718 85,214
Accrued expenses .......................................... 232,277 221,705
Deferred income taxes ....................................... 58,441 66,208
Current maturities of long-term debt ............................ 2,000 1,079
Total current liabilities ....................................... 687,132 617,918
Long-term debt less current maturities ............................. 198,000 294,043
Other long-term liabilities ...................................... 53,818 77,216
Deferred gain from asset sales ................................... 127,427 140,273
Stockholders’ equity:
Common stock, par value $1 per share: authorized 500,000,000 shares;
issued 68,557,041 shares .................................... 68,557 68,557
Additional paid-in capital ..................................... 295,679 296,462
Retained earnings .......................................... 430,148 423,437
Accumulated other comprehensive loss ........................... (980) (17,649)
Treasury stock, at cost—15,431,298 shares and 15,803,322 shares ........ (255,832) (266,478)
Total stockholders’ equity ..................................... 537,572 504,329
Total liabilities and stockholders’ equity ............................ $1,603,949 $1,633,779
See notes to the consolidated financial statements
37