Pep Boys 2012 Annual Report Download - page 79
Download and view the complete annual report
Please find page 79 of the 2012 Pep Boys annual report below. You can navigate through the pages in the report by either clicking on the pages listed below, or by using the keyword search tool below to find specific information within the annual report.-
 1
1 -
2
-
3
-
4
-
5
-
6
-
7
-
8
-
9
-
10
-
11
-
12
-
13
-
14
-
15
-
16
-
17
-
18
-
19
-
20
-
21
-
22
-
23
-
24
-
25
-
26
-
27
-
28
-
29
-
30
-
31
-
32
-
33
-
34
-
35
-
36
-
37
-
38
-
39
-
40
-
41
-
42
-
43
-
44
-
45
-
46
-
47
-
48
-
49
-
50
-
51
-
52
-
53
-
54
-
55
-
56
-
57
-
58
-
59
-
60
-
61
-
62
-
63
-
64
-
65
-
66
-
67
-
68
-
 69
69 -
 70
70 -
 71
71 -
 72
72 -
 73
73 -
 74
74 -
 75
75 -
 76
76 -
 77
77 -
 78
78 -
 79
79 -
 80
80 -
 81
81 -
 82
82 -
 83
83 -
 84
84 -
 85
85 -
 86
86 -
 87
87 -
 88
88 -
 89
89 -
90
-
91
-
92
-
93
-
94
-
95
-
96
-
97
-
98
-
99
-
100
-
101
-
102
-
103
-
104
-
105
-
106
-
107
-
108
-
109
-
110
-
111
-
112
-
113
-
114
-
115
-
116
-
117
-
118
-
119
-
120
-
121
-
122
-
123
-
124
-
125
-
126
-
127
-
128
-
129
-
130
-
131
 |
 |

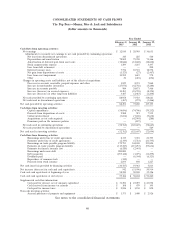
CONSOLIDATED STATEMENTS OF CASH FLOWS
The Pep Boys—Manny, Moe & Jack and Subsidiaries
(dollar amounts in thousands)
Year Ended
February 2, January 28, January 29,
2013 2012 2011
Cash flows from operating activities:
Net earnings ................................................ $ 12,810 $ 28,903 $ 36,631
Adjustments to reconcile net earnings to net cash provided by continuing operations:
Net loss from discontinued operations ............................. 345 225 540
Depreciation and amortization ................................. 78,805 79,390 74,366
Amortization of deferred gain from asset sales ....................... (12,846) (12,602) (12,602)
Stock compensation expense ................................... 1,299 3,237 3,497
Loss from debt retirement .................................... — — 200
Deferred income taxes ....................................... 7,576 10,301 18,572
Net gain from dispositions of assets .............................. (1,323) (27) (2,467)
Loss from asset impairment ................................... 10,555 1,619 970
Other ................................................. 30 (421) (694)
Changes in operating assets and liabilities, net of the effects of acquisitions:
Decrease in accounts receivable, prepaid expenses and other .............. 3,829 2,391 7,060
Increase in merchandise inventories .............................. (27,074) (42,756) (5,284)
Increase in accounts payable ................................... 984 24,871 7,466
Increase (decrease) in accrued expenses ............................ 10,481 (18,745) (8,394)
Increase (decrease) in other long-term liabilities ...................... 3,487 (2,463) (1,200)
Net cash provided by continuing operations ............................ 88,958 73,923 118,661
Net cash used in discontinued operations .............................. (467) (273) (1,466)
Net cash provided by operating activities ............................... 88,491 73,650 117,195
Cash flows from investing activities:
Capital expenditures ........................................ (54,696) (74,746) (70,252)
Proceeds from dispositions of assets .............................. 5,588 515 7,515
Collateral investment ....................................... (3,654) (7,638) (9,638)
Acquisitions, net of cash acquired. ............................... — (42,901) (288)
Premiums paid on life insurance policies ........................... — (837) —
Net cash used in continuing operations ............................... (52,762) (125,607) (72,663)
Net cash provided by discontinued operations ........................... — — 569
Net cash used in investing activities ................................... (52,762) (125,607) (72,094)
Cash flows from financing activities:
Borrowings under line of credit agreements ......................... 2,319 5,721 21,795
Payments under line of credit agreements .......................... (2,319) (5,721) (21,795)
Borrowings on trade payable program liability ........................ 179,751 144,180 121,824
Payments on trade payable program liability ......................... (115,247) (115,253) (99,636)
Payments for finance issuance cost ............................... (6,520) (2,441) —
Borrowings under new debt ................................... 200,000 — —
Debt payments ........................................... (295,122) (1,079) (11,279)
Dividends paid ........................................... — (6,344) (6,323)
Repurchase of common stock .................................. (342) — —
Proceeds from stock issuance .................................. 2,693 898 1,227
Net cash (used in) provided by financing activities ......................... (34,787) 19,961 5,813
Net increase (decrease) in cash and cash equivalents ........................ 942 (31,996) 50,914
Cash and cash equivalents at beginning of year ........................... 58,244 90,240 39,326
Cash and cash equivalents at end of year ............................... 59,186 $ 58,244 $ 90,240
Supplemental cash flow information:
Cash paid for interest, net of amounts capitalized ..................... $ 31,290 $ 23,097 $ 23,098
Cash received from income tax refunds ............................ $ 108 $ 479 $ 195
Cash paid for income taxes .................................... $ 2,826 $ 1,150 $ 890
Non-cash investing activities:
Accrued purchases of property and equipment ....................... $ 1,371 $ 1,400 $ 2,926
See notes to the consolidated financial statements
40