Pep Boys 2012 Annual Report Download - page 110
Download and view the complete annual report
Please find page 110 of the 2012 Pep Boys annual report below. You can navigate through the pages in the report by either clicking on the pages listed below, or by using the keyword search tool below to find specific information within the annual report.-
 1
1 -
2
-
3
-
4
-
5
-
6
-
7
-
8
-
9
-
10
-
11
-
12
-
13
-
14
-
15
-
16
-
17
-
18
-
19
-
20
-
21
-
22
-
23
-
24
-
25
-
26
-
27
-
28
-
29
-
30
-
31
-
32
-
33
-
34
-
35
-
36
-
37
-
38
-
39
-
40
-
41
-
42
-
43
-
44
-
45
-
46
-
47
-
48
-
49
-
50
-
51
-
52
-
53
-
54
-
55
-
56
-
57
-
58
-
59
-
60
-
61
-
62
-
63
-
64
-
65
-
66
-
67
-
68
-
69
-
70
-
71
-
72
-
73
-
74
-
75
-
76
-
77
-
78
-
79
-
80
-
81
-
82
-
83
-
84
-
85
-
86
-
87
-
88
-
89
-
90
-
91
-
92
-
93
-
94
-
95
-
96
-
97
-
98
-
99
-
 100
100 -
 101
101 -
 102
102 -
 103
103 -
 104
104 -
 105
105 -
 106
106 -
 107
107 -
 108
108 -
 109
109 -
 110
110 -
 111
111 -
 112
112 -
 113
113 -
 114
114 -
 115
115 -
 116
116 -
 117
117 -
 118
118 -
 119
119 -
 120
120 -
121
-
122
-
123
-
124
-
125
-
126
-
127
-
128
-
129
-
130
-
131
 |
 |
THE PEP BOYS—MANNY, MOE & JACK AND SUBSIDIARIES
NOTES TO CONSOLIDATED FINANCIAL STATEMENTS (Continued)
Years ended February 2, 2013, January 28, 2012 and January 29, 2011
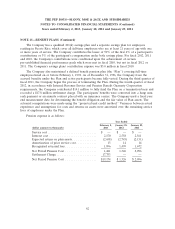
NOTE 14—EQUITY COMPENSATION PLANS (Continued)
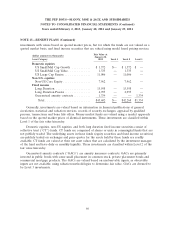
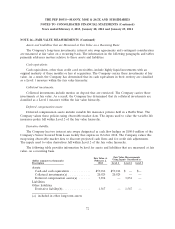
During fiscal 2011, the Company began an employee stock purchase plan which provides eligible
employees the opportunity to purchase shares of the Company’s stock at a stated discount through
regular payroll deductions. The aggregate number of shares of common stock that may be issued or
transferred under the plan is 2,000,000 shares. All shares purchased by employees under this plan will
be issued through treasury stock. The Company’s expense for the discount during fiscal years 2012 and
2011 was immaterial. As of February 2, 2013, there were 1,916,178 shares available for issuing under
this plan.
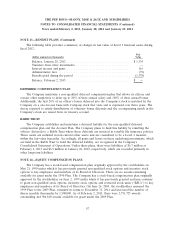
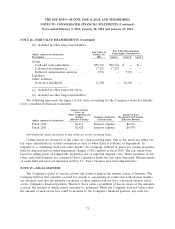
NOTE 15—INTEREST RATE SWAP AGREEMENT
On October 11, 2012, the Company settled its interest rate swap designated as a cash flow hedge
on $145.0 million of the Company’s Term Loan prior to its amendment and restatement. The swap was
used to minimize interest rate exposure and overall interest costs by converting the variable component
of the total interest rate to a fixed rate of 5.036%. Since February 1, 2008, this swap was deemed to be
fully effective and all adjustments in the interest rate swap’s fair value were recorded to accumulated
other comprehensive loss. The settlement of this swap resulted in an interest charge of $7.5 million,
which was previously recorded within accumulated other comprehensive loss. As of January 28, 2012,
the fair value of this swap was a net $12.5 million payable, recorded within other long-term liabilities
on the balance sheet.
On October 11, 2012, the Company entered into two new interest rate swaps for a notional
amount of $50.0 million each that together are designated as a cash flow hedge on the first
$100.0 million of the amended and restated Term Loan. The interest rate swaps convert the variable
LIBOR portion of the interest payments due on the first $100.0 million of the Term Loan to a fixed
rate of 1.855%. As of February 2, 2013, the fair value of the new swap was a net $1.6 million payable,
recorded within other long-term liabilities on the balance sheet.
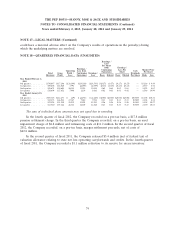
NOTE 16—FAIR VALUE MEASUREMENTS
The Company’s fair value measurements consist of (a) non-financial assets and liabilities that are
recognized or disclosed at fair value in the Company’s financial statements on a recurring basis (at least
annually) and (b) all financial assets and liabilities.
Fair value is defined as the exit price, or the amount that would be received to sell an asset or
paid to transfer a liability in an orderly transaction between market participants as of the measurement
date. There is a hierarchy for inputs used in measuring fair value that maximizes the use of observable
inputs and minimizes the use of unobservable inputs by requiring that the most observable inputs be
used when available. Observable inputs are inputs market participants would use in valuing the asset or
liability developed based on market data obtained from sources independent of the Company.
Unobservable inputs are inputs that reflect the Company’s assumptions about the factors market
participants would use in valuing the asset or liability developed based upon the best information
available in the circumstances. The hierarchy is broken down into three levels. Level 1 inputs are
quoted prices (unadjusted) in active markets for identical assets or liabilities. Level 2 inputs include
quoted prices for similar assets or liabilities in active markets. Level 3 inputs are unobservable inputs
for the asset or liability. Categorization within the valuation hierarchy is based upon the lowest level of
input that is significant to the fair value measurement.
71