Pep Boys 2012 Annual Report Download - page 65
Download and view the complete annual report
Please find page 65 of the 2012 Pep Boys annual report below. You can navigate through the pages in the report by either clicking on the pages listed below, or by using the keyword search tool below to find specific information within the annual report.-
 1
1 -
2
-
3
-
4
-
5
-
6
-
7
-
8
-
9
-
10
-
11
-
12
-
13
-
14
-
15
-
16
-
17
-
18
-
19
-
20
-
21
-
22
-
23
-
24
-
25
-
26
-
27
-
28
-
29
-
30
-
31
-
32
-
33
-
34
-
35
-
36
-
37
-
38
-
39
-
40
-
41
-
42
-
43
-
44
-
45
-
46
-
47
-
48
-
49
-
50
-
51
-
52
-
53
-
54
-
 55
55 -
 56
56 -
 57
57 -
 58
58 -
 59
59 -
 60
60 -
 61
61 -
 62
62 -
 63
63 -
 64
64 -
 65
65 -
 66
66 -
 67
67 -
 68
68 -
 69
69 -
 70
70 -
 71
71 -
 72
72 -
 73
73 -
 74
74 -
 75
75 -
76
-
77
-
78
-
79
-
80
-
81
-
82
-
83
-
84
-
85
-
86
-
87
-
88
-
89
-
90
-
91
-
92
-
93
-
94
-
95
-
96
-
97
-
98
-
99
-
100
-
101
-
102
-
103
-
104
-
105
-
106
-
107
-
108
-
109
-
110
-
111
-
112
-
113
-
114
-
115
-
116
-
117
-
118
-
119
-
120
-
121
-
122
-
123
-
124
-
125
-
126
-
127
-
128
-
129
-
130
-
131
 |
 |

and credits. The fiscal 2010 effective tax rate includes a $2.2 million benefit related to the reduction of
a valuation allowance on certain state net operating losses and credits.
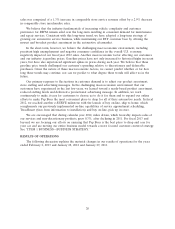
As a result of the foregoing, we reported net earnings of $28.9 million for fiscal 2011, a decrease
of $7.7 million, or 21.1%, as compared to net earnings of $36.6 million for fiscal 2010. Our diluted
earnings per share were $0.54 for fiscal 2011 as compared to $0.69 for fiscal 2010.
Discontinued Operations
The analysis of our results of continuing operations excludes the operating results of closed stores,
where the customer base could not be maintained, which have been classified as discontinued
operations for all periods presented.
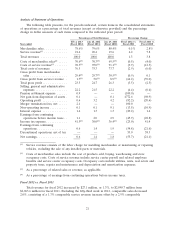
Industry Comparison
We operate in the U.S. automotive aftermarket, which has two general lines of business: (1) the
Service business, defined as Do-It-For-Me (service labor, installed merchandise and tires) and (2) the
Retail business, defined as Do-It-Yourself (retail merchandise) and commercial. Generally, specialized
automotive retailers focus on either the Service or Retail area of the business. We believe that
operation in both the Service and Retail areas positively differentiates us from most of our competitors.
Although we manage our performance at a store level in aggregation, we believe that the following
presentation, which includes the reclassification of revenue from merchandise that we install in
customer vehicles to service center revenue, shows an accurate comparison against competitors within
the two sales arenas. We compete in the Retail area of the business through our retail sales floor and
commercial sales business. Our Service Center business competes in the Service area of the industry.
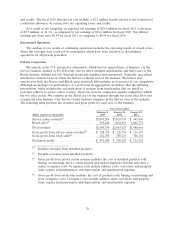
The following table presents the revenues and gross profit for each area of the business.
Fiscal Year ended
February 2, January 28, January 29,
(dollar amounts in thousands) 2013 2012 2011
Service center revenue(1) ................ $1,095,284 $1,038,714 $ 941,869
Retail sales(2) ........................ 995,446 1,024,913 1,046,772
Total revenues ....................... $2,090,730 $2,063,627 $1,988,641
Gross profit from service center revenue(3) . . . $ 208,795 $ 220,314 $ 216,176
Gross profit from retail sales(4) ............ 282,705 289,213 306,176
Total gross profit ...................... $ 491,500 $ 509,527 $ 522,352
(1) Includes revenues from installed products.
(2) Excludes revenues from installed products.
(3) Gross profit from service center revenue includes the cost of installed products sold,
buying, warehousing, service center payroll and related employee benefits and service
center occupancy costs. Occupancy costs include utilities, rents, real estate and property
taxes, repairs and maintenance and depreciation and amortization expenses.
(4) Gross profit from retail sales includes the cost of products sold, buying, warehousing and
store occupancy costs. Occupancy costs include utilities, rents, real estate and property
taxes, repairs and maintenance and depreciation and amortization expenses.
26