Pep Boys 2012 Annual Report Download - page 112
Download and view the complete annual report
Please find page 112 of the 2012 Pep Boys annual report below. You can navigate through the pages in the report by either clicking on the pages listed below, or by using the keyword search tool below to find specific information within the annual report.-
 1
1 -
2
-
3
-
4
-
5
-
6
-
7
-
8
-
9
-
10
-
11
-
12
-
13
-
14
-
15
-
16
-
17
-
18
-
19
-
20
-
21
-
22
-
23
-
24
-
25
-
26
-
27
-
28
-
29
-
30
-
31
-
32
-
33
-
34
-
35
-
36
-
37
-
38
-
39
-
40
-
41
-
42
-
43
-
44
-
45
-
46
-
47
-
48
-
49
-
50
-
51
-
52
-
53
-
54
-
55
-
56
-
57
-
58
-
59
-
60
-
61
-
62
-
63
-
64
-
65
-
66
-
67
-
68
-
69
-
70
-
71
-
72
-
73
-
74
-
75
-
76
-
77
-
78
-
79
-
80
-
81
-
82
-
83
-
84
-
85
-
86
-
87
-
88
-
89
-
90
-
91
-
92
-
93
-
94
-
95
-
96
-
97
-
98
-
99
-
100
-
101
-
 102
102 -
 103
103 -
 104
104 -
 105
105 -
 106
106 -
 107
107 -
 108
108 -
 109
109 -
 110
110 -
 111
111 -
 112
112 -
 113
113 -
 114
114 -
 115
115 -
 116
116 -
 117
117 -
 118
118 -
 119
119 -
 120
120 -
 121
121 -
 122
122 -
123
-
124
-
125
-
126
-
127
-
128
-
129
-
130
-
131
 |
 |

THE PEP BOYS—MANNY, MOE & JACK AND SUBSIDIARIES
NOTES TO CONSOLIDATED FINANCIAL STATEMENTS (Continued)
Years ended February 2, 2013, January 28, 2012 and January 29, 2011
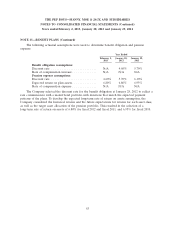
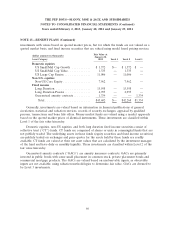
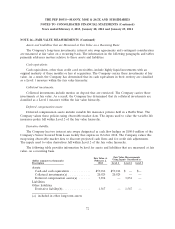
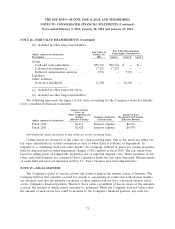
NOTE 16—FAIR VALUE MEASUREMENTS (Continued)
(b) included in other long-term liabilities
Fair Value Measurements
Fair Value at Using Inputs Considered as
(dollar amounts in thousands) January 28,
Description 2012 Level 1 Level 2 Level 3
Assets:
Cash and cash equivalents ........... $58,244 $58,244 $ — $—
Collateral investments(a) ............ 17,276 17,276 — —
Deferred compensation assets(a) ...... 3,576 — 3,576 —
Liabilities:
Other liabilities
Derivative liability(b) ............... 12,540 — 12,540 —
(a) included in other long-term assets
(b) included in other long-term liabilities
The following represents the impact of fair value accounting for the Company’s derivative liability
on its consolidated financial statements:
Amount of Gain/
(Loss) in
Other Comprehensive Amount of Loss
Income Earnings Statement Recognized in Earnings
(Effective Portion) Classification (Effective Portion)
(dollar amounts in thousands)
Fiscal 2012 .......... $2,171 Interest expense $4,676
Fiscal 2011 .......... $2,428 Interest expense $6,970
Non-financial assets measured at fair value on a non-recurring basis:
Certain assets are measured at fair value on a non-recurring basis, that is, the assets are subject to
fair value adjustments in certain circumstances such as when there is evidence of impairment. In
response to a continuing weak real estate market, the Company reduced its prices for certain properties
held for disposal and recorded impairment charges of $0.2 million in fiscal 2010. The fair values were
based on selling prices of comparable properties, net of expected disposal costs. These measures of fair
value, and related inputs, are considered level 2 measures under the fair value hierarchy. Measurements
of assets held and used are discussed in Note 11, ‘‘Store Closures and Asset Impairments.’’
NOTE 17—LEGAL MATTERS
The Company is party to various actions and claims arising in the normal course of business. The
Company believes that amounts accrued for awards or assessments in connection with all such matters
are adequate and that the ultimate resolution of these matters will not have a material adverse effect
on the Company’s financial position. However, there exists a possibility of loss in excess of the amounts
accrued, the amount of which cannot currently be estimated. While the Company does not believe that
the amount of such excess loss could be material to the Company’s financial position, any such loss
73