Pep Boys 2012 Annual Report Download - page 58
Download and view the complete annual report
Please find page 58 of the 2012 Pep Boys annual report below. You can navigate through the pages in the report by either clicking on the pages listed below, or by using the keyword search tool below to find specific information within the annual report.-
 1
1 -
2
-
3
-
4
-
5
-
6
-
7
-
8
-
9
-
10
-
11
-
12
-
13
-
14
-
15
-
16
-
17
-
18
-
19
-
20
-
21
-
22
-
23
-
24
-
25
-
26
-
27
-
28
-
29
-
30
-
31
-
32
-
33
-
34
-
35
-
36
-
37
-
38
-
39
-
40
-
41
-
42
-
43
-
44
-
45
-
46
-
47
-
 48
48 -
 49
49 -
 50
50 -
 51
51 -
 52
52 -
 53
53 -
 54
54 -
 55
55 -
 56
56 -
 57
57 -
 58
58 -
 59
59 -
 60
60 -
 61
61 -
 62
62 -
 63
63 -
 64
64 -
 65
65 -
 66
66 -
 67
67 -
 68
68 -
69
-
70
-
71
-
72
-
73
-
74
-
75
-
76
-
77
-
78
-
79
-
80
-
81
-
82
-
83
-
84
-
85
-
86
-
87
-
88
-
89
-
90
-
91
-
92
-
93
-
94
-
95
-
96
-
97
-
98
-
99
-
100
-
101
-
102
-
103
-
104
-
105
-
106
-
107
-
108
-
109
-
110
-
111
-
112
-
113
-
114
-
115
-
116
-
117
-
118
-
119
-
120
-
121
-
122
-
123
-
124
-
125
-
126
-
127
-
128
-
129
-
130
-
131
 |
 |
ITEM 7 MANAGEMENT’S DISCUSSION AND ANALYSIS OF FINANCIAL CONDITION AND
RESULTS OF OPERATIONS
OVERVIEW
The following discussion and analysis explains the results of our operations for fiscal 2012 and
2011 and developments affecting our financial condition as of February 2, 2013. This discussion and
analysis below should be read in conjunction with Item 6 ‘‘Selected Consolidated Financial Data,’’ and
our consolidated financial statements and the notes included elsewhere in this report. The discussion
and analysis contains ‘‘forward looking statements’’ within the meaning of The Private Securities
Litigation Reform Act of 1995. Forward looking statements include management’s expectations
regarding implementation of its long-term strategic plan, future financial performance, automotive
aftermarket trends, levels of competition, business development activities, future capital expenditures,
financing sources and availability and the effects of regulation and litigation. Actual results may differ
materially from the results discussed in the forward looking statements due to a number of factors
beyond our control, including those set forth under the section entitled ‘‘Item 1A Risk Factors’’
elsewhere in this report.
Introduction
The Pep Boys—Manny, Moe & Jack and subsidiaries (the ‘‘Company’’) has been the best place to
shop and care for your car since it began operations in 1921. Over 19,000 associates are focused on
delivering the best customer service in the automotive aftermarket to our customers across our 750+
locations located throughout the United States and Puerto Rico. Pep Boys satisfies all of a customer’s
automotive needs through our unique offering of service, tires, parts and accessories.
Our stores are organized into a hub and spoke network consisting of Supercenters and Service &
Tire Centers. Supercenters average approximately 20,000 square feet (our new Supercenter format is
approximately 14,000 square feet) and combine do-it-for-me service labor, installed merchandise and
tire offerings (‘‘DIFM’’) with do-it-yourself parts and accessories (‘‘DIY’’). Most of our Supercenters
also have a commercial sales program that delivers parts, tires and equipment to automotive repair
shops and dealers. Service & Tire Centers, which average approximately 6,000 square feet, provide
DIFM services in neighborhood locations that are conveniently located where our customers live or
work. Service & Tire Centers are designed to capture market share and leverage our existing
Supercenters and support infrastructure. We also operate a handful of legacy DIY only Pep Express
stores.
In fiscal 2012, we opened 20 Service & Tire Centers and six Supercenters and converted one Pep
Express store into a Supercenter. We also closed four Service & Tire Centers and two Supercenters. As
of February 2, 2013, we operated 567 Supercenters, 185 Service & Tire Centers and 6 Pep Express
stores located in 35 states and Puerto Rico.
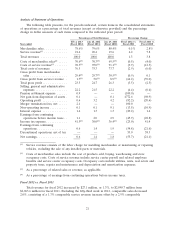
EXECUTIVE SUMMARY
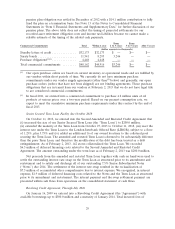
Net earnings for fiscal 2012 were $12.8 million, or $0.24 per share, as compared to $28.9 million,
or $0.54 per share, reported for fiscal 2011. Excluding certain unusual items, the year over year
decrease in profitability was primarily due to lower total gross profit margins and higher selling, general
and administrative expenses, partially offset by increased sales (resulting from the 53rd week in fiscal
2012) and reduced interest expense.
Total revenues (excluding the additional week in fiscal 2012) declined by 0.4% or $ 9.0 million, as
compared to the same period in the prior year due to a 2.0% decline in comparable store sales (sales
generated by locations in operation during the same period of the prior year) which was partially offset
by increased contribution from our non-comparable store locations. This decrease in comparable store
19