Pep Boys 2012 Annual Report Download - page 41
Download and view the complete annual report
Please find page 41 of the 2012 Pep Boys annual report below. You can navigate through the pages in the report by either clicking on the pages listed below, or by using the keyword search tool below to find specific information within the annual report.-
 1
1 -
2
-
3
-
4
-
5
-
6
-
7
-
8
-
9
-
10
-
11
-
12
-
13
-
14
-
15
-
16
-
17
-
18
-
19
-
20
-
21
-
22
-
23
-
24
-
25
-
26
-
27
-
28
-
29
-
30
-
 31
31 -
 32
32 -
 33
33 -
 34
34 -
 35
35 -
 36
36 -
 37
37 -
 38
38 -
 39
39 -
 40
40 -
 41
41 -
 42
42 -
 43
43 -
 44
44 -
 45
45 -
 46
46 -
 47
47 -
 48
48 -
 49
49 -
 50
50 -
 51
51 -
52
-
53
-
54
-
55
-
56
-
57
-
58
-
59
-
60
-
61
-
62
-
63
-
64
-
65
-
66
-
67
-
68
-
69
-
70
-
71
-
72
-
73
-
74
-
75
-
76
-
77
-
78
-
79
-
80
-
81
-
82
-
83
-
84
-
85
-
86
-
87
-
88
-
89
-
90
-
91
-
92
-
93
-
94
-
95
-
96
-
97
-
98
-
99
-
100
-
101
-
102
-
103
-
104
-
105
-
106
-
107
-
108
-
109
-
110
-
111
-
112
-
113
-
114
-
115
-
116
-
117
-
118
-
119
-
120
-
121
-
122
-
123
-
124
-
125
-
126
-
127
-
128
-
129
-
130
-
131
 |
 |

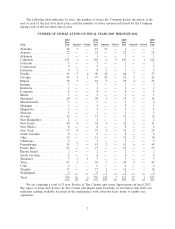
The following table indicates, by state, the number of stores the Company had in operation at the
end of each of the last four fiscal years, and the number of stores opened and closed by the Company
during each of the last three fiscal years:
NUMBER OF STORES AT END OF FISCAL YEARS 2009 THROUGH 2012
2012 2011 2010 2009
Year Year Year Year
State End Opened Closed End Opened Closed End Opened Closed End
Alabama ................. 38 1 — 37 36 — 1 — — 1
Arizona .................. 22 — — 22 — — 22 — — 22
Arkansas ................. 1 — — 1 — — 1 — — 1
California ................ 131 1 — 130 4 3 129 6 1 124
Colorado ................. 7 — — 7 — — 7 — — 7
Connecticut ............... 7 — — 7 — — 7 — — 7
Delaware ................. 9 1 — 8 1 — 7 — — 7
Florida .................. 91 5 4 90 30 — 60 7 — 53
Georgia .................. 49 3 1 47 22 — 25 3 — 22
Illinois .................. 35 3 — 32 3 — 29 4 — 25
Indiana .................. 7 — — 7 — — 7 — — 7
Kentucky ................. 4 — — 4 — — 4 — — 4
Louisiana ................ 8 — — 8 — — 8 — — 8
Maine ................... 1 — — 1 — — 1 — — 1
Maryland ................ 20 — — 20 1 — 19 1 — 18
Massachusetts ............. 7 — — 7 — — 7 1 — 6
Michigan ................. 5 — — 5 — — 5 — — 5
Minnesota ................ 3 — — 3 — — 3 — — 3
Missouri ................. 1 — — 1 — — 1 — — 1
Nevada .................. 12 — — 12 — — 12 — — 12
New Hampshire ............ 4 — — 4 — — 4 — — 4
New Jersey ............... 40 4 — 36 4 — 32 1 — 31
New Mexico .............. 8 — — 8 — — 8 — — 8
New York ................ 37 4 — 33 2 — 31 2 — 29
North Carolina ............ 8 — — 8 — — 8 — — 8
Ohio.................... 12 — — 12 — — 12 2 — 10
Oklahoma ................ 5 — — 5 — — 5 — — 5
Pennsylvania .............. 55 2 — 53 2 — 51 6 — 45
Puerto Rico ............... 27 — — 27 — — 27 — — 27
Rhode Island .............. 2 — — 2 — — 2 — — 2
South Carolina ............ 6 — — 6 — — 6 — — 6
Tennessee ................ 7 1 1 7 — — 7 — — 7
Texas .................... 57 1 — 56 7 — 49 2 — 47
Utah.................... 6 — — 6 — — 6 — — 6
Virginia .................. 17 — — 17 1 — 16 — — 16
Washington ............... 9 — — 9 7 — 2 — — 2
Total .................... 758 26 6 738 120 3 621 35 1 587
We are targeting a total of 31 new Service & Tire Centers and seven Supercenters in fiscal 2013.
We expect to lease new Service & Tire Center and Supercenter locations, as we believe that there are
sufficient existing available locations in the marketplace with attractive lease terms to enable our
expansion.
2