Pep Boys 2012 Annual Report Download - page 89
Download and view the complete annual report
Please find page 89 of the 2012 Pep Boys annual report below. You can navigate through the pages in the report by either clicking on the pages listed below, or by using the keyword search tool below to find specific information within the annual report.-
 1
1 -
2
-
3
-
4
-
5
-
6
-
7
-
8
-
9
-
10
-
11
-
12
-
13
-
14
-
15
-
16
-
17
-
18
-
19
-
20
-
21
-
22
-
23
-
24
-
25
-
26
-
27
-
28
-
29
-
30
-
31
-
32
-
33
-
34
-
35
-
36
-
37
-
38
-
39
-
40
-
41
-
42
-
43
-
44
-
45
-
46
-
47
-
48
-
49
-
50
-
51
-
52
-
53
-
54
-
55
-
56
-
57
-
58
-
59
-
60
-
61
-
62
-
63
-
64
-
65
-
66
-
67
-
68
-
69
-
70
-
71
-
72
-
73
-
74
-
75
-
76
-
77
-
78
-
 79
79 -
 80
80 -
 81
81 -
 82
82 -
 83
83 -
 84
84 -
 85
85 -
 86
86 -
 87
87 -
 88
88 -
 89
89 -
 90
90 -
 91
91 -
 92
92 -
 93
93 -
 94
94 -
 95
95 -
 96
96 -
 97
97 -
 98
98 -
 99
99 -
100
-
101
-
102
-
103
-
104
-
105
-
106
-
107
-
108
-
109
-
110
-
111
-
112
-
113
-
114
-
115
-
116
-
117
-
118
-
119
-
120
-
121
-
122
-
123
-
124
-
125
-
126
-
127
-
128
-
129
-
130
-
131
 |
 |

THE PEP BOYS—MANNY, MOE & JACK AND SUBSIDIARIES
NOTES TO CONSOLIDATED FINANCIAL STATEMENTS (Continued)
Years ended February 2, 2013, January 28, 2012 and January 29, 2011
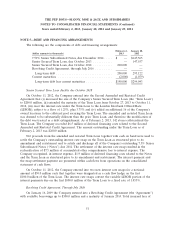
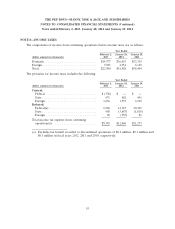
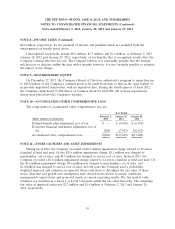
NOTE 2—ACQUISITIONS (Continued)
Intangible assets consist of trade names ($0.6 million) and favorable leases ($0.3 million).
Long-term liabilities include unfavorable leases ($9.1 million). The trade names are being amortized
over their estimated useful life of 3 years. The favorable and unfavorable lease intangible assets and
liabilities are being amortized to rent expense over their respective lease terms, ranging from 2 to
16 years. Amortization expense for the favorable and unfavorable leases over the next four years is
approximately $0.6 million per year. Deferred tax assets in the amount of $6.8 million are primarily
recorded in other non-current liabilities.
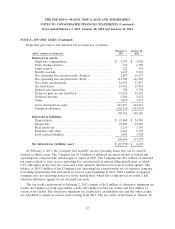
Sales for the fiscal 2011 acquired stores totaled $63.9 million from acquisition date through
January 28, 2012. The net loss for the acquired stores for the period from acquisition date through
January 28, 2012 was $2.0 million, excluding transition related expenses.
As the acquisitions (including Big 10) were immaterial to the operating results both individually
and in aggregate for the fifty-two week periods ended January 28, 2012 and January 29, 2011, pro
forma results for the fifty-two week period ended January 28, 2012 are not presented.
In 2011, the Company recorded a reduction to the contingent consideration of $0.7 million related
to one of the Company’s acquisitions. The reversal of contingent consideration was recorded to selling,
general and administrative expenses in the consolidated statements of operations.
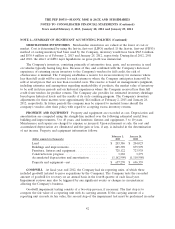
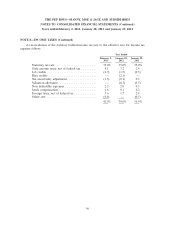
NOTE 3—OTHER CURRENT ASSETS
The following are the components of other current assets:
February 2, January 28,
(dollar amounts in thousands) 2013 2012
Reinsurance receivable ............................ $59,160 $59,280
Income taxes receivable ............................ 668 89
Other ......................................... 610 610
Total ......................................... $60,438 $59,979
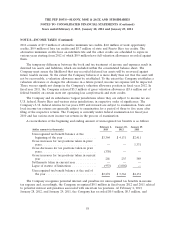
NOTE 4—ACCRUED EXPENSES
The following are the components of accrued expenses:
February 2, January 28,
(dollar amounts in thousands) 2013 2012
Casualty and medical risk insurance ................... $152,606 $147,806
Accrued compensation and related taxes ............... 27,641 19,133
Sales tax payable ................................. 11,556 12,254
Other ......................................... 40,474 42,512
Total ......................................... $232,277 $221,705
50