Pep Boys 2012 Annual Report Download - page 109
Download and view the complete annual report
Please find page 109 of the 2012 Pep Boys annual report below. You can navigate through the pages in the report by either clicking on the pages listed below, or by using the keyword search tool below to find specific information within the annual report.-
 1
1 -
2
-
3
-
4
-
5
-
6
-
7
-
8
-
9
-
10
-
11
-
12
-
13
-
14
-
15
-
16
-
17
-
18
-
19
-
20
-
21
-
22
-
23
-
24
-
25
-
26
-
27
-
28
-
29
-
30
-
31
-
32
-
33
-
34
-
35
-
36
-
37
-
38
-
39
-
40
-
41
-
42
-
43
-
44
-
45
-
46
-
47
-
48
-
49
-
50
-
51
-
52
-
53
-
54
-
55
-
56
-
57
-
58
-
59
-
60
-
61
-
62
-
63
-
64
-
65
-
66
-
67
-
68
-
69
-
70
-
71
-
72
-
73
-
74
-
75
-
76
-
77
-
78
-
79
-
80
-
81
-
82
-
83
-
84
-
85
-
86
-
87
-
88
-
89
-
90
-
91
-
92
-
93
-
94
-
95
-
96
-
97
-
98
-
 99
99 -
 100
100 -
 101
101 -
 102
102 -
 103
103 -
 104
104 -
 105
105 -
 106
106 -
 107
107 -
 108
108 -
 109
109 -
 110
110 -
 111
111 -
 112
112 -
 113
113 -
 114
114 -
 115
115 -
 116
116 -
 117
117 -
 118
118 -
 119
119 -
120
-
121
-
122
-
123
-
124
-
125
-
126
-
127
-
128
-
129
-
130
-
131
 |
 |

THE PEP BOYS—MANNY, MOE & JACK AND SUBSIDIARIES
NOTES TO CONSOLIDATED FINANCIAL STATEMENTS (Continued)
Years ended February 2, 2013, January 28, 2012 and January 29, 2011
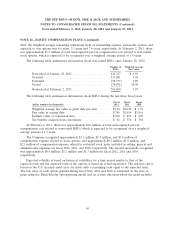
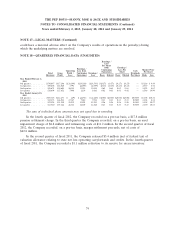
NOTE 14—EQUITY COMPENSATION PLANS (Continued)
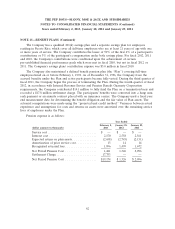
both a market and a service condition, the Monte Carlo simulation model is used. The following are
the weighted-average assumptions:
Year ended
February 2, January 28, January 29,
2013 2012 2011
Dividend yield .......................... 0% 1.0% 1.35%
Expected volatility ....................... 58% 58% 56%
Risk-free interest rate range:
High................................. 0.6% 1.9% 2.0%
Low................................. 0.5% 1.6% 0.9%
Ranges of expected lives in years ............ 4 - 5 4 - 5 4 - 5
The Company granted approximately 106,000 and 95,000 RSUs in fiscal 2012 and 2011,
respectively that will vest if the employees remain continuously employed through the third anniversary
date of the grant and the Company achieves a return on invested capital target for fiscal year 2014 and
2013, respectively. The number of underlying shares that may be issued upon vesting will range from
0% to 150%, depending upon the Company achieving the financial targets in fiscal year 2014 and 2013,
respectively. At the date of the grants, the fair values were $9.98 per unit and $12.48 per unit for the
2012 and 2011 awards, respectively. The Company also granted approximately 53,000 and 48,000 RSUs
for fiscal 2012 and 2011, respectively, that will vest if the employees remain continuously employed
through the third anniversary date of the grant and will become exercisable if the Company satisfies a
total shareholder return target in fiscal 2014 and 2013, respectively. The number of underlying shares
that may become exercisable will range from 0% to 175% depending upon whether the market
condition is achieved. The Company used a Monte Carlo simulation to estimate a $7.96 per unit and
$14.73 per unit grant date fair value for the 2012 and 2011 RSUs, respectively. The non-vested
restricted stock award table reflects the maximum vesting of underlying shares for performance and
market based awards granted in both 2012 and 2011.
The company did not grant any restricted stock units for officers’ deferred bonus matches under
the Company’s non-qualified deferred compensation plan during fiscal 2012. During fiscal 2011, the
Company granted approximately 50,000 restricted stock units related to officers’ deferred bonus
matches under the Company’s non-qualified deferred compensation plan which vest over a three year
period. The fair value of these awards was $13.68 per unit. During fiscal 2012, the Company granted
approximately 33,000 restricted stock units to its non-employee directors of the board, which vest over
a one year period with a quarter vesting on each of the first four quarters following their grant date.
The fair value was $9.98 per unit. During fiscal 2011, the Company granted approximately 42,000
restricted stock units to its non-employee directors of the board that vested immediately. The fair value
for these awards was $10.67 per unit.
The Company reflects in its consolidated statement of cash flows any tax benefits realized upon
the exercise of stock options or issuance of RSUs in excess of that which is associated with the expense
recognized for financial reporting purposes. The amounts reflected as financing cash inflows and
operating cash outflows in the Consolidated Statement of Cash Flows for fiscal 2012, 2011 and 2010 are
immaterial.
70