Pep Boys 2012 Annual Report Download - page 105
Download and view the complete annual report
Please find page 105 of the 2012 Pep Boys annual report below. You can navigate through the pages in the report by either clicking on the pages listed below, or by using the keyword search tool below to find specific information within the annual report.-
 1
1 -
2
-
3
-
4
-
5
-
6
-
7
-
8
-
9
-
10
-
11
-
12
-
13
-
14
-
15
-
16
-
17
-
18
-
19
-
20
-
21
-
22
-
23
-
24
-
25
-
26
-
27
-
28
-
29
-
30
-
31
-
32
-
33
-
34
-
35
-
36
-
37
-
38
-
39
-
40
-
41
-
42
-
43
-
44
-
45
-
46
-
47
-
48
-
49
-
50
-
51
-
52
-
53
-
54
-
55
-
56
-
57
-
58
-
59
-
60
-
61
-
62
-
63
-
64
-
65
-
66
-
67
-
68
-
69
-
70
-
71
-
72
-
73
-
74
-
75
-
76
-
77
-
78
-
79
-
80
-
81
-
82
-
83
-
84
-
85
-
86
-
87
-
88
-
89
-
90
-
91
-
92
-
93
-
94
-
 95
95 -
 96
96 -
 97
97 -
 98
98 -
 99
99 -
 100
100 -
 101
101 -
 102
102 -
 103
103 -
 104
104 -
 105
105 -
 106
106 -
 107
107 -
 108
108 -
 109
109 -
 110
110 -
 111
111 -
 112
112 -
 113
113 -
 114
114 -
 115
115 -
116
-
117
-
118
-
119
-
120
-
121
-
122
-
123
-
124
-
125
-
126
-
127
-
128
-
129
-
130
-
131
 |
 |

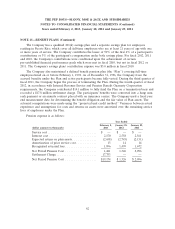
THE PEP BOYS—MANNY, MOE & JACK AND SUBSIDIARIES
NOTES TO CONSOLIDATED FINANCIAL STATEMENTS (Continued)
Years ended February 2, 2013, January 28, 2012 and January 29, 2011
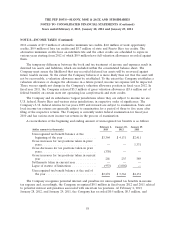
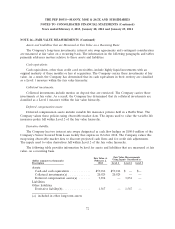
NOTE 13—BENEFIT PLANS (Continued)
investments with values based on quoted market prices, but for which the funds are not valued on a
quoted market basis, and fixed income securities that are valued using model based pricing services.
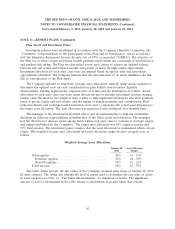
Fair Value at
(dollar amounts in thousands) January 28,
Asset Category 2012 Level 1 Level 2 Level 3
Domestic equities
US Small/Mid Cap Growth ........... $ 1,372 $— $ 1,372 $ —
US Small/Mid Cap Value ............. 1,335 — 1,335 —
US Large Cap Passive ............... 11,006 — 11,006 —
Non-U.S. equities
Non-US Core Equity ................ 7,962 — 7,962 —
Fixed income
Long Duration .................... 15,598 — 15,598 —
Long Duration Passive ............... 4,995 — 4,995 —
Guaranteed annuity contracts .......... 1,334 — — 1,334
Total .......................... $43,602 $— $42,268 $1,334
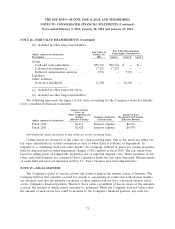
Generally, investments are valued based on information in financial publications of general
circulation, statistical and valuation services, records of security exchanges, appraisal by qualified
persons, transactions and bona fide offers. Money market funds are valued using a market approach
based on the quoted market prices of identical instruments. These investments are classified within
Level 1 of the fair value hierarchy.
Domestic equities, non-US equities, and both long duration fixed income securities consist of
collective trust (‘‘CT’’) funds. CT funds are comprised of shares or units in commingled funds that are
not publicly traded. The underlying assets in these funds (equity securities and fixed income securities)
are publicly traded on exchanges and price quotes for the assets held by these funds are readily
available. CT funds are valued at their net asset values that are calculated by the investment manager
of the fund and have daily or monthly liquidity. These investments are classified within Level 2 of the
fair value hierarchy.
Guaranteed annuity contracts (‘‘GACs’’) are annuity insurance contracts. GACs are primarily
invested in public bonds with some small placement in common stock, private placement bonds and
commercial mortgage products. The GACs are valued based on unobservable inputs, as observable
inputs are not available, using valuation methodologies to determine fair value. GACs are deemed to
be Level 3 investments.
66