Pep Boys 2012 Annual Report Download - page 108
Download and view the complete annual report
Please find page 108 of the 2012 Pep Boys annual report below. You can navigate through the pages in the report by either clicking on the pages listed below, or by using the keyword search tool below to find specific information within the annual report.-
 1
1 -
2
-
3
-
4
-
5
-
6
-
7
-
8
-
9
-
10
-
11
-
12
-
13
-
14
-
15
-
16
-
17
-
18
-
19
-
20
-
21
-
22
-
23
-
24
-
25
-
26
-
27
-
28
-
29
-
30
-
31
-
32
-
33
-
34
-
35
-
36
-
37
-
38
-
39
-
40
-
41
-
42
-
43
-
44
-
45
-
46
-
47
-
48
-
49
-
50
-
51
-
52
-
53
-
54
-
55
-
56
-
57
-
58
-
59
-
60
-
61
-
62
-
63
-
64
-
65
-
66
-
67
-
68
-
69
-
70
-
71
-
72
-
73
-
74
-
75
-
76
-
77
-
78
-
79
-
80
-
81
-
82
-
83
-
84
-
85
-
86
-
87
-
88
-
89
-
90
-
91
-
92
-
93
-
94
-
95
-
96
-
97
-
 98
98 -
 99
99 -
 100
100 -
 101
101 -
 102
102 -
 103
103 -
 104
104 -
 105
105 -
 106
106 -
 107
107 -
 108
108 -
 109
109 -
 110
110 -
 111
111 -
 112
112 -
 113
113 -
 114
114 -
 115
115 -
 116
116 -
 117
117 -
 118
118 -
119
-
120
-
121
-
122
-
123
-
124
-
125
-
126
-
127
-
128
-
129
-
130
-
131
 |
 |

THE PEP BOYS—MANNY, MOE & JACK AND SUBSIDIARIES
NOTES TO CONSOLIDATED FINANCIAL STATEMENTS (Continued)
Years ended February 2, 2013, January 28, 2012 and January 29, 2011
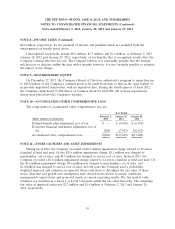
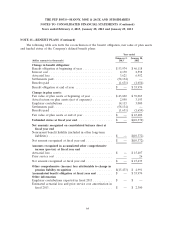
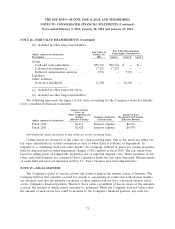
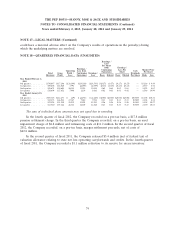
NOTE 14—EQUITY COMPENSATION PLANS (Continued)
2013, the weighted average remaining contractual term of outstanding options, exercisable options and
expected to vest options was 4.6 years, 3.3 years and 7.4 years, respectively. At February 2, 2013, there
was approximately $1.7 million of total unrecognized pre-tax compensation cost related to non-vested
stock options, which is expected to be recognized over a weighted average period of 1.5 years.
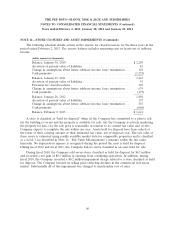
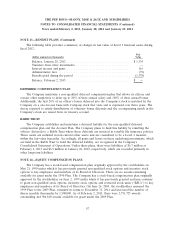
The following table summarizes information about non-vested RSUs since January 28, 2012:
Number of Weighted Average
RSUs Fair Value
Nonvested at January 28, 2012 .................... 626,747 $ 9.93
Granted .................................... 319,081 9.48
Forfeited ................................... (78,737) 9.89
Vested ..................................... (70,491) 10.90
Nonvested at February 2, 2013 .................... 796,600 9.67
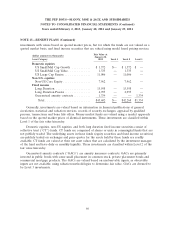
The following table summarizes information about RSUs during the last three fiscal years:
Fiscal Fiscal Fiscal
(dollar amounts in thousands) 2012 2011 2010
Weighted average fair value at grant date per unit ....... $9.48 $10.45 $ 9.32
Fair value at vesting date ......................... $768 $1,498 $1,861
Intrinsic value at conversion date ................... $218 $ 896 $ 809
Tax benefits realized from conversions ................ $ 82 $ 336 $ 301
At February 2, 2013, there was approximately $2.0 million of total unrecognized pre-tax
compensation cost related to non-vested RSUs, which is expected to be recognized over a weighted-
average period of 1.3 years.
The Company recognized approximately $1.1 million, $1.3 million, and $1.4 million of
compensation expense related to stock options, and approximately $0.2 million, $1.9 million, and
$2.1 million of compensation expense related to restricted stock units, included in selling, general and
administrative expenses for fiscal 2012, 2011, and 2010, respectively. The related tax benefit recognized
was approximately $0.4 million, $1.2 million and $1.3 million for fiscal 2012, 2011 and 2010,
respectively.
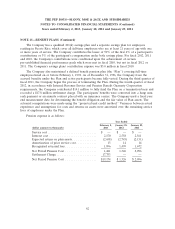
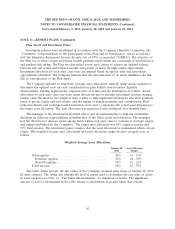
Expected volatility is based on historical volatilities for a time period similar to that of the
expected term and the expected term of the options is based on actual experience. The risk-free rate is
based on the U.S. treasury yield curve for issues with a remaining term equal to the expected term.
The fair value of each option granted during fiscal 2012, 2011 and 2010 is estimated on the date of
grant using the Black-Scholes option-pricing model and, in certain situations where the grant includes
69