Pep Boys 2012 Annual Report Download - page 77
Download and view the complete annual report
Please find page 77 of the 2012 Pep Boys annual report below. You can navigate through the pages in the report by either clicking on the pages listed below, or by using the keyword search tool below to find specific information within the annual report.-
 1
1 -
2
-
3
-
4
-
5
-
6
-
7
-
8
-
9
-
10
-
11
-
12
-
13
-
14
-
15
-
16
-
17
-
18
-
19
-
20
-
21
-
22
-
23
-
24
-
25
-
26
-
27
-
28
-
29
-
30
-
31
-
32
-
33
-
34
-
35
-
36
-
37
-
38
-
39
-
40
-
41
-
42
-
43
-
44
-
45
-
46
-
47
-
48
-
49
-
50
-
51
-
52
-
53
-
54
-
55
-
56
-
57
-
58
-
59
-
60
-
61
-
62
-
63
-
64
-
65
-
66
-
 67
67 -
 68
68 -
 69
69 -
 70
70 -
 71
71 -
 72
72 -
 73
73 -
 74
74 -
 75
75 -
 76
76 -
 77
77 -
 78
78 -
 79
79 -
 80
80 -
 81
81 -
 82
82 -
 83
83 -
 84
84 -
 85
85 -
 86
86 -
 87
87 -
88
-
89
-
90
-
91
-
92
-
93
-
94
-
95
-
96
-
97
-
98
-
99
-
100
-
101
-
102
-
103
-
104
-
105
-
106
-
107
-
108
-
109
-
110
-
111
-
112
-
113
-
114
-
115
-
116
-
117
-
118
-
119
-
120
-
121
-
122
-
123
-
124
-
125
-
126
-
127
-
128
-
129
-
130
-
131
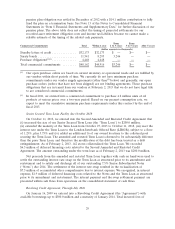
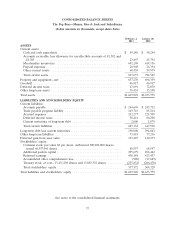
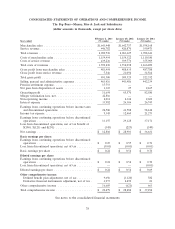
 |
 |

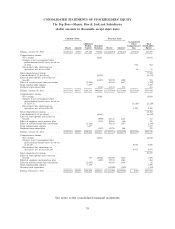
CONSOLIDATED STATEMENTS OF OPERATIONS AND COMPREHENSIVE INCOME
The Pep Boys—Manny, Moe & Jack and Subsidiaries
(dollar amounts in thousands, except per share data)
February 2, 2013 January 28, 2012 January 29, 2011
Year ended (53 weeks) (52 weeks) (52 weeks)
Merchandise sales ............................ $1,643,948 $1,642,757 $1,598,168
Service revenue .............................. 446,782 420,870 390,473
Total revenues ............................... 2,090,730 2,063,627 1,988,641
Costs of merchandise sales ...................... 1,159,994 1,154,322 1,110,380
Costs of service revenue ........................ 439,236 399,776 355,909
Total costs of revenues ......................... 1,599,230 1,554,098 1,466,289
Gross profit from merchandise sales ............... 483,954 488,435 487,788
Gross profit from service revenue ................. 7,546 21,094 34,564
Total gross profit ............................. 491,500 509,529 522,352
Selling, general and administrative expenses .......... 463,416 443,986 442,239
Pension settlement expense ...................... 17,753 — —
Net gain from disposition of assets ................ 1,323 27 2,467
Operating profit ............................. 11,654 65,570 82,580
Merger termination fees, net ..................... 42,816 — —
Non-operating income ......................... 2,012 2,324 2,609
Interest expense ............................. 33,982 26,306 26,745
Earnings from continuing operations before income taxes
and discontinued operations ................... 22,500 41,588 58,444
Income tax expense ........................... 9,345 12,460 21,273
Earnings from continuing operations before discontinued
operations ................................ 13,155 29,128 37,171
Loss from discontinued operations, net of tax benefit of
$(186), $(121) and $(291) ..................... (345) (225) (540)
Net earnings ................................ $ 12,810 $ 28,903 $ 36,631
Basic earnings per share:
Earnings from continuing operations before discontinued
operations ................................ $ 0.25 $ 0.55 $ 0.71
Loss from discontinued operations, net of tax ......... (0.01) (0.01) (0.01)
Basic earnings per share ........................ $ 0.24 $ 0.54 $ 0.70
Diluted earnings per share:
Earnings from continuing operations before discontinued
operations ................................ $ 0.24 $ 0.54 $ 0.70
Loss from discontinued operations, net of tax ......... — — (0.01)
Diluted earnings per share ...................... $ 0.24 $ 0.54 $ 0.69
Other comprehensive income:
Defined benefit plan adjustment, net of tax ......... 9,696 (3,120) 582
Derivative financial instruments adjustment, net of tax . 6,973 2,499 81
Other comprehensive income .................... 16,669 (621) 663
Total comprehensive income ..................... $ 29,479 $ 28,282 $ 37,294
See notes to the consolidated financial statements
38