Pep Boys 2012 Annual Report Download - page 111
Download and view the complete annual report
Please find page 111 of the 2012 Pep Boys annual report below. You can navigate through the pages in the report by either clicking on the pages listed below, or by using the keyword search tool below to find specific information within the annual report.-
 1
1 -
2
-
3
-
4
-
5
-
6
-
7
-
8
-
9
-
10
-
11
-
12
-
13
-
14
-
15
-
16
-
17
-
18
-
19
-
20
-
21
-
22
-
23
-
24
-
25
-
26
-
27
-
28
-
29
-
30
-
31
-
32
-
33
-
34
-
35
-
36
-
37
-
38
-
39
-
40
-
41
-
42
-
43
-
44
-
45
-
46
-
47
-
48
-
49
-
50
-
51
-
52
-
53
-
54
-
55
-
56
-
57
-
58
-
59
-
60
-
61
-
62
-
63
-
64
-
65
-
66
-
67
-
68
-
69
-
70
-
71
-
72
-
73
-
74
-
75
-
76
-
77
-
78
-
79
-
80
-
81
-
82
-
83
-
84
-
85
-
86
-
87
-
88
-
89
-
90
-
91
-
92
-
93
-
94
-
95
-
96
-
97
-
98
-
99
-
100
-
 101
101 -
 102
102 -
 103
103 -
 104
104 -
 105
105 -
 106
106 -
 107
107 -
 108
108 -
 109
109 -
 110
110 -
 111
111 -
 112
112 -
 113
113 -
 114
114 -
 115
115 -
 116
116 -
 117
117 -
 118
118 -
 119
119 -
 120
120 -
 121
121 -
122
-
123
-
124
-
125
-
126
-
127
-
128
-
129
-
130
-
131
 |
 |

THE PEP BOYS—MANNY, MOE & JACK AND SUBSIDIARIES
NOTES TO CONSOLIDATED FINANCIAL STATEMENTS (Continued)
Years ended February 2, 2013, January 28, 2012 and January 29, 2011
NOTE 16—FAIR VALUE MEASUREMENTS (Continued)
Assets and Liabilities that are Measured at Fair Value on a Recurring Basis:
The Company’s long-term investments, interest rate swap agreements and contingent consideration
are measured at fair value on a recurring basis. The information in the following paragraphs and tables
primarily addresses matters relative to these assets and liabilities.
Cash equivalents:
Cash equivalents, other than credit card receivables, include highly liquid investments with an
original maturity of three months or less at acquisition. The Company carries these investments at fair
value. As a result, the Company has determined that its cash equivalents in their entirety are classified
as a Level 1 measure within the fair value hierarchy.
Collateral investments:
Collateral investments include monies on deposit that are restricted. The Company carries these
investments at fair value. As a result, the Company has determined that its collateral investments are
classified as a Level 1 measure within the fair value hierarchy.
Deferred compensation assets:
Deferred compensation assets include variable life insurance policies held in a Rabbi Trust. The
Company values these policies using observable market data. The inputs used to value the variable life
insurance policy fall within Level 2 of the fair value hierarchy.
Derivative liability:
The Company has two interest rate swaps designated as cash flow hedges on $100.0 million of the
Company’s Senior Secured Term Loan facility that expires in October 2018. The Company values this
swap using observable market data to discount projected cash flows and for credit risk adjustments.
The inputs used to value derivatives fall within Level 2 of the fair value hierarchy.
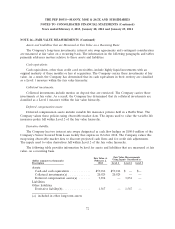
The following table provides information by level for assets and liabilities that are measured at fair
value, on a recurring basis.
Fair Value Measurements
Fair Value at Using Inputs Considered as
(dollar amounts in thousands) February 2,
Description 2013 Level 1 Level 2 Level 3
Assets:
Cash and cash equivalents ............ $59,186 $59,186 $ — $—
Collateral investments(a) ............. 20,929 20,929 — —
Deferred compensation assets(a) ....... 3,834 — 3,834 —
Liabilities:
Other liabilities
Derivative liability(b) ................ 1,567 — 1,567 —
(a) included in other long-term assets
72