Pep Boys 2012 Annual Report Download - page 107
Download and view the complete annual report
Please find page 107 of the 2012 Pep Boys annual report below. You can navigate through the pages in the report by either clicking on the pages listed below, or by using the keyword search tool below to find specific information within the annual report.-
 1
1 -
2
-
3
-
4
-
5
-
6
-
7
-
8
-
9
-
10
-
11
-
12
-
13
-
14
-
15
-
16
-
17
-
18
-
19
-
20
-
21
-
22
-
23
-
24
-
25
-
26
-
27
-
28
-
29
-
30
-
31
-
32
-
33
-
34
-
35
-
36
-
37
-
38
-
39
-
40
-
41
-
42
-
43
-
44
-
45
-
46
-
47
-
48
-
49
-
50
-
51
-
52
-
53
-
54
-
55
-
56
-
57
-
58
-
59
-
60
-
61
-
62
-
63
-
64
-
65
-
66
-
67
-
68
-
69
-
70
-
71
-
72
-
73
-
74
-
75
-
76
-
77
-
78
-
79
-
80
-
81
-
82
-
83
-
84
-
85
-
86
-
87
-
88
-
89
-
90
-
91
-
92
-
93
-
94
-
95
-
96
-
 97
97 -
 98
98 -
 99
99 -
 100
100 -
 101
101 -
 102
102 -
 103
103 -
 104
104 -
 105
105 -
 106
106 -
 107
107 -
 108
108 -
 109
109 -
 110
110 -
 111
111 -
 112
112 -
 113
113 -
 114
114 -
 115
115 -
 116
116 -
 117
117 -
118
-
119
-
120
-
121
-
122
-
123
-
124
-
125
-
126
-
127
-
128
-
129
-
130
-
131
 |
 |

THE PEP BOYS—MANNY, MOE & JACK AND SUBSIDIARIES
NOTES TO CONSOLIDATED FINANCIAL STATEMENTS (Continued)
Years ended February 2, 2013, January 28, 2012 and January 29, 2011
NOTE 14—EQUITY COMPENSATION PLANS (Continued)
Incentive stock options and non-qualified stock options granted under the 1990 and 2009 plans to
non-officers vest fully on the third anniversary of their grant date and officers vest in equal tranches
over three or four year periods. Generally, all options granted prior to March 3, 2004 carry an
expiration date of ten years and options granted on or after March 3, 2004 carry an expiration date of
seven years. RSUs previously granted to non-officers vest fully on the third anniversary of their grant
date. RSUs previously granted to officers vest in equal tranches over three or four year periods.
The Company has also granted RSUs under the 2009 plan in conjunction with its non-qualified
deferred compensation plan. Under the deferred compensation plan, the first 20% of an officer’s bonus
deferred into the Company’s stock fund is matched by the Company on a one-for-one basis with RSUs
that vest over a three-year period, with one third vesting on each of the first three anniversaries of the
grant date.
The exercise price, term and other conditions applicable to future stock option and RSU grants
under the 2009 plan are generally determined by the Board of Directors; provided that the exercise
price of stock options must be at least 100% of the quoted market price of the common stock on the
grant date. The Company currently satisfies all share requirements resulting from RSU conversions and
option exercises from its treasury stock. The Company believes its treasury share balance at February 2,
2013 is adequate to satisfy such activity during the next twelve-month period.
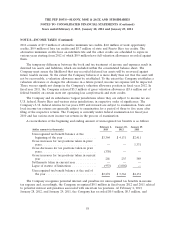
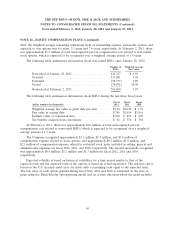
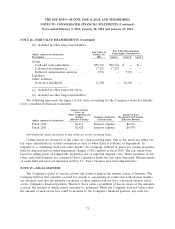
The following table summarizes the options under the plans:
Fiscal Year 2012
Weighted
Average
Exercise
Shares Price
Outstanding—beginning of year ....................... 2,008,430 $ 8.97
Granted ........................................ 287,574 9.97
Exercised ........................................ (274,769) 7.00
Forfeited ........................................ (55,283) 11.32
Expired ......................................... (287,359) 15.89
Outstanding—end of year ............................ 1,678,593 8.20
Vested and expected to vest options—end of year .......... 1,630,311 8.15
Options exercisable—end of year ...................... 1,153,837 7.07
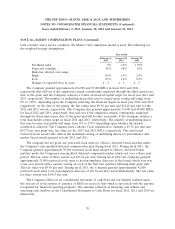
The following table summarizes information about options during the last three fiscal years (dollars
in thousands except per option):
Fiscal Fiscal Fiscal
2012 2011 2010
Weighted average fair value at grant date per option ....... $4.65 $5.38 $4.28
Intrinsic value of options exercised .................... $874 $202 $609
The aggregate intrinsic value of outstanding options, exercisable options and expected to vest
options at February 2, 2013 was $5.5 million, $5.2 million and $0.3 million, respectively. At February 2,
68