Pep Boys 2012 Annual Report Download - page 40
Download and view the complete annual report
Please find page 40 of the 2012 Pep Boys annual report below. You can navigate through the pages in the report by either clicking on the pages listed below, or by using the keyword search tool below to find specific information within the annual report.-
 1
1 -
2
-
3
-
4
-
5
-
6
-
7
-
8
-
9
-
10
-
11
-
12
-
13
-
14
-
15
-
16
-
17
-
18
-
19
-
20
-
21
-
22
-
23
-
24
-
25
-
26
-
27
-
28
-
29
-
 30
30 -
 31
31 -
 32
32 -
 33
33 -
 34
34 -
 35
35 -
 36
36 -
 37
37 -
 38
38 -
 39
39 -
 40
40 -
 41
41 -
 42
42 -
 43
43 -
 44
44 -
 45
45 -
 46
46 -
 47
47 -
 48
48 -
 49
49 -
 50
50 -
51
-
52
-
53
-
54
-
55
-
56
-
57
-
58
-
59
-
60
-
61
-
62
-
63
-
64
-
65
-
66
-
67
-
68
-
69
-
70
-
71
-
72
-
73
-
74
-
75
-
76
-
77
-
78
-
79
-
80
-
81
-
82
-
83
-
84
-
85
-
86
-
87
-
88
-
89
-
90
-
91
-
92
-
93
-
94
-
95
-
96
-
97
-
98
-
99
-
100
-
101
-
102
-
103
-
104
-
105
-
106
-
107
-
108
-
109
-
110
-
111
-
112
-
113
-
114
-
115
-
116
-
117
-
118
-
119
-
120
-
121
-
122
-
123
-
124
-
125
-
126
-
127
-
128
-
129
-
130
-
131
 |
 |

PART I
ITEM 1 BUSINESS
GENERAL
The Pep Boys—Manny, Moe & Jack and subsidiaries (the ‘‘Company’’) has been the best place to
shop and care for your car since it began operations in 1921. Over 19,000 associates are focused on
delivering the best customer service in the automotive aftermarket for our customers across our 750+
locations located throughout the United States and Puerto Rico. Pep Boys satisfies all of a customer’s
automotive needs through our unique offering of service, tires, parts, accessories and knowledge.
Our stores are organized in a hub and spoke network consisting of Supercenters and Service &
Tire Centers. Supercenters average approximately 20,000 square feet (our new Supercenter format is
approximately 14,000 square feet) and combine do-it-for-me service labor, installed merchandise and
tire offerings (‘‘DIFM’’) with do-it-yourself parts and accessories (‘‘DIY’’). Most of our Supercenters
also have a commercial sales program that delivers parts, tires and equipment to automotive repair
shops and dealers. Service & Tire Centers, which average approximately 6,000 square feet, provide
DIFM services in neighborhood locations that are conveniently located where our customers live, work
and shop. Service & Tire Centers are designed to capture market share and leverage our existing
Supercenters and support infrastructure. We also operate a handful of legacy DIY only Pep Express
stores.
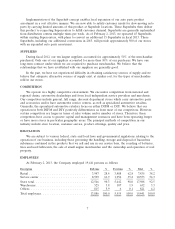
The following table sets forth the percentage of total revenues from continuing operations
contributed by each class of similar products or services for the Company and should be read in
conjunction with the Consolidated Financial Statements and Notes thereto included elsewhere herein:
Year ended
February 2, January 28, January 29,
2013 2012 2011
Parts and accessories ..................... 59.9% 61.0% 63.5%
Tires ................................ 18.7 18.6 16.9
Total merchandise sales ................... 78.6 79.6 80.4
Service labor ........................... 21.4 20.4 19.6
Total revenues .......................... 100.0% 100.0% 100.0%
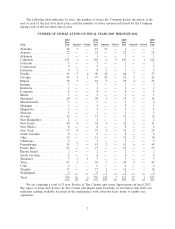
In fiscal 2012, we opened 20 Service & Tire Centers and six Supercenters and converted one Pep
Express store into a Supercenter. We also closed four Service & Tire Centers and two Supercenters. As
of February 2, 2013, the Company operated 567 Supercenters, 185 Service & Tire Centers and six Pep
Express stores located in 35 states and Puerto Rico. These locations consist of approximately 12,780,000
of gross square feet of retail space, including over 7,300 service bays.
1