Pep Boys 2012 Annual Report Download - page 66
Download and view the complete annual report
Please find page 66 of the 2012 Pep Boys annual report below. You can navigate through the pages in the report by either clicking on the pages listed below, or by using the keyword search tool below to find specific information within the annual report.-
 1
1 -
2
-
3
-
4
-
5
-
6
-
7
-
8
-
9
-
10
-
11
-
12
-
13
-
14
-
15
-
16
-
17
-
18
-
19
-
20
-
21
-
22
-
23
-
24
-
25
-
26
-
27
-
28
-
29
-
30
-
31
-
32
-
33
-
34
-
35
-
36
-
37
-
38
-
39
-
40
-
41
-
42
-
43
-
44
-
45
-
46
-
47
-
48
-
49
-
50
-
51
-
52
-
53
-
54
-
55
-
 56
56 -
 57
57 -
 58
58 -
 59
59 -
 60
60 -
 61
61 -
 62
62 -
 63
63 -
 64
64 -
 65
65 -
 66
66 -
 67
67 -
 68
68 -
 69
69 -
 70
70 -
 71
71 -
 72
72 -
 73
73 -
 74
74 -
 75
75 -
 76
76 -
77
-
78
-
79
-
80
-
81
-
82
-
83
-
84
-
85
-
86
-
87
-
88
-
89
-
90
-
91
-
92
-
93
-
94
-
95
-
96
-
97
-
98
-
99
-
100
-
101
-
102
-
103
-
104
-
105
-
106
-
107
-
108
-
109
-
110
-
111
-
112
-
113
-
114
-
115
-
116
-
117
-
118
-
119
-
120
-
121
-
122
-
123
-
124
-
125
-
126
-
127
-
128
-
129
-
130
-
131
 |
 |
CAPITAL & LIQUIDITY
Capital Resources and Needs
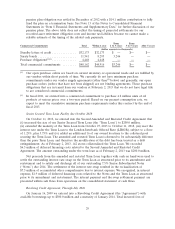
Our cash requirements arise principally from (i) the purchase of inventory and capital expenditures
related to existing and new stores, offices and distribution centers, (ii) debt service and (iii) contractual
obligations. Cash flows realized through the sale of automotive services, tires, parts and accessories are
our primary source of liquidity. Net cash provided by operating activities was $88.5 million in fiscal
2012, as compared to $73.7 million in the prior year period. The $14.8 million increase was due to a
favorable change in operating assets and liabilities of $28.4 million partially offset by a decrease in net
earnings, net of non-cash adjustments of $13.4 million. The change in operating assets and liabilities
was primarily due to favorable changes in accrued expenses and other current assets of $30.7 million
and other long-term liabilities of $6.0 million partially offset by an unfavorable change in inventory, net
of accounts payable, of $8.2 million.
The favorable change in accrued expenses and other current assets was primarily due to an
increase in employee payroll tax accruals of $12.2 million due to the timing of payments to taxing
authorities and a reduction in employer contributions under our savings, supplemental executive
retirement and bonus plans of $9.6 million.
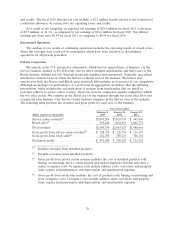
In both fiscal 2012 and 2011, the increased investment in inventory of $27.1 and $42.8 million,
respectively, was funded by improvements in our trade vendor payment terms. Taking into account the
changes in our trade payable program liability (shown as cash flows from financing activities on the
consolidated statements of cash flows), cash generated from accounts payable was $65.5 million and
$53.8 million for fiscal 2012 and 2011, respectively. The ratio of accounts payable, including our trade
payable program, to inventory was 61.5% at February 2, 2013 and 53.6% at January 28, 2012. The
$27.1 million increase in inventory from January 28, 2012 was primarily due to an expanded inventory
assortment in certain hard part categories, seasonal purchases and increased investment in our new
stores.
In the fourth quarter of fiscal 2012, we contributed $14.1 million to fully fund, on a termination
basis, our previously frozen defined benefit pension plan.
Cash used in investing activities was $52.8 million in fiscal 2012 as compared to $125.6 million in
the prior year period. Capital expenditures were $54.7 million and $74.7 million in fiscal 2012 and 2011,
respectively. Capital expenditures for fiscal 2012 included the addition of 20 Service & Tire Centers, six
Supercenters, the conversion of seven Supercenters into Superhubs, the addition of 17 Speed Shops
within existing Supercenters and information technology enhancements including our eCommerce
initiatives and parts catalog enhancements. Capital expenditures for fiscal 2011 included the addition of
20 new Service & Tire Centers, the conversion of one Service & Tire Center and one Pep Express
store to Supercenters, and the addition of one new Supercenter. In fiscal 2012 we sold our regional
administrative office in Los Angeles, CA for approximately $5.6 million, net of closing costs. During
fiscal 2011, we acquired 99 Service & Tire Centers through three separate transactions for
$42.6 million, net of cash acquired. In addition, during fiscal 2012 and fiscal 2011 we invested
$3.7 million and $7.6 million, respectively in a restricted account as collateral for retained liabilities
included within existing insurance programs in lieu of previously outstanding letters of credit.
Our targeted capital expenditures for fiscal 2013 are $65.0 million. Our fiscal year 2013 capital
expenditures include the addition of approximately 38 new locations, the conversion of 15 Supercenters
into Superhubs, the addition of 50 Speed Shops to existing Supercenters and required expenditures for
our existing stores, offices and distribution centers. These expenditures are expected to be funded by
cash on hand and net cash generated from operating activities. Additional capacity, if needed, exists
under our existing line of credit.
27