Pep Boys 2012 Annual Report Download - page 100
Download and view the complete annual report
Please find page 100 of the 2012 Pep Boys annual report below. You can navigate through the pages in the report by either clicking on the pages listed below, or by using the keyword search tool below to find specific information within the annual report.-
 1
1 -
2
-
3
-
4
-
5
-
6
-
7
-
8
-
9
-
10
-
11
-
12
-
13
-
14
-
15
-
16
-
17
-
18
-
19
-
20
-
21
-
22
-
23
-
24
-
25
-
26
-
27
-
28
-
29
-
30
-
31
-
32
-
33
-
34
-
35
-
36
-
37
-
38
-
39
-
40
-
41
-
42
-
43
-
44
-
45
-
46
-
47
-
48
-
49
-
50
-
51
-
52
-
53
-
54
-
55
-
56
-
57
-
58
-
59
-
60
-
61
-
62
-
63
-
64
-
65
-
66
-
67
-
68
-
69
-
70
-
71
-
72
-
73
-
74
-
75
-
76
-
77
-
78
-
79
-
80
-
81
-
82
-
83
-
84
-
85
-
86
-
87
-
88
-
89
-
 90
90 -
 91
91 -
 92
92 -
 93
93 -
 94
94 -
 95
95 -
 96
96 -
 97
97 -
 98
98 -
 99
99 -
 100
100 -
 101
101 -
 102
102 -
 103
103 -
 104
104 -
 105
105 -
 106
106 -
 107
107 -
 108
108 -
 109
109 -
 110
110 -
111
-
112
-
113
-
114
-
115
-
116
-
117
-
118
-
119
-
120
-
121
-
122
-
123
-
124
-
125
-
126
-
127
-
128
-
129
-
130
-
131
 |
 |

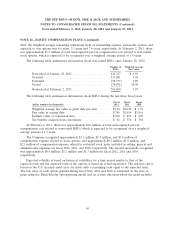
THE PEP BOYS—MANNY, MOE & JACK AND SUBSIDIARIES
NOTES TO CONSOLIDATED FINANCIAL STATEMENTS (Continued)
Years ended February 2, 2013, January 28, 2012 and January 29, 2011
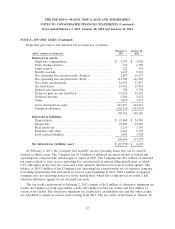
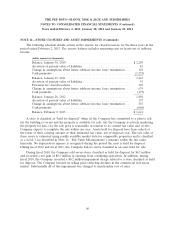
NOTE 12—EARNINGS PER SHARE
Basic earnings per share is based on net earnings divided by the weighted average number of
shares outstanding during the period. The following schedule presents the calculation of basic and
diluted earnings per share for earnings from continuing operations:
Year Ended
February 2, January 28, January 29,
2013 2012 2011
(dollar amounts in thousands, except per share amounts)
(a) Earnings from continuing operations before discontinued
operations .................................... $13,155 $29,128 $37,171
Loss from discontinued operations, net of tax benefit of
$(186), $(121) and $(291) ......................... (345) (225) (540)
Net earnings .................................... $12,810 $28,903 $36,631
(b) Basic average number of common shares outstanding during
period ....................................... 53,225 52,958 52,677
Common shares assumed issued upon exercise of dilutive
stock options, net of assumed repurchase, at the average
market price .................................. 729 673 485
(c) Diluted average number of common shares assumed
outstanding during period ......................... 53,954 53,631 53,162
Basic earnings per share:
Earnings from continuing operations (a/b) ............... $ 0.25 $ 0.55 $ 0.71
Discontinued operations, net of tax .................... (0.01) (0.01) (0.01)
Basic earnings per share ............................ $ 0.24 $ 0.54 $ 0.70
Diluted earnings per share:
Earnings from continuing operations (a/c) ............... $ 0.24 $ 0.54 $ 0.70
Discontinued operations, net of tax .................... — — (0.01)
Diluted earnings per share .......................... $ 0.24 $ 0.54 $ 0.69
Certain stock options were excluded from the calculations of diluted earnings per share because
their exercise prices were greater than the average market price of the common shares for the period
then ended and therefore would be anti-dilutive. The total number of such shares excluded from the
diluted earnings per share calculation was 859,000, 870,000 and 978,000 as of February 2, 2013,
January 28, 2012, and January 29, 2011, respectively.
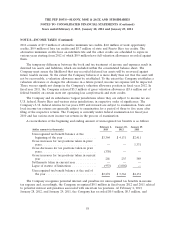
NOTE 13—BENEFIT PLANS
DEFINED BENEFIT AND CONTRIBUTION PLANS
The Company maintains a non-qualified defined contribution plan (the ‘‘Account Plan’’) for key
employees designated by the Board of Directors. The Company’s contribution expense for the Account
Plan was $0.1 million, $0.3 million and $1.2 million for fiscal 2012, 2011 and 2010, respectively.
61