Oracle 2006 Annual Report Download - page 59
Download and view the complete annual report
Please find page 59 of the 2006 Oracle annual report below. You can navigate through the pages in the report by either clicking on the pages listed below, or by using the keyword search tool below to find specific information within the annual report.-
 1
1 -
2
-
3
-
4
-
5
-
6
-
7
-
8
-
9
-
10
-
11
-
12
-
13
-
14
-
15
-
16
-
17
-
18
-
19
-
20
-
21
-
22
-
23
-
24
-
25
-
26
-
27
-
28
-
29
-
30
-
31
-
32
-
33
-
34
-
35
-
36
-
37
-
38
-
39
-
40
-
41
-
42
-
43
-
44
-
45
-
46
-
47
-
48
-
 49
49 -
 50
50 -
 51
51 -
 52
52 -
 53
53 -
 54
54 -
 55
55 -
 56
56 -
 57
57 -
 58
58 -
 59
59 -
 60
60 -
 61
61 -
 62
62 -
 63
63 -
 64
64 -
 65
65 -
 66
66 -
 67
67 -
 68
68 -
 69
69 -
70
-
71
-
72
-
73
-
74
-
75
-
76
-
77
-
78
-
79
-
80
-
81
-
82
-
83
-
84
-
85
-
86
-
87
-
88
-
89
-
90
-
91
-
92
-
93
-
94
-
95
-
96
-
97
-
98
-
99
-
100
-
101
-
102
-
103
-
104
-
105
-
106
-
107
-
108
-
109
-
110
-
111
-
112
-
113
-
114
-
115
-
116
-
117
-
118
-
119
-
120
-
121
-
122
-
123
-
124
-
125
-
126
-
127
-
128
-
129
-
130
-
131
-
132
-
133
 |
 |

Table of Contents
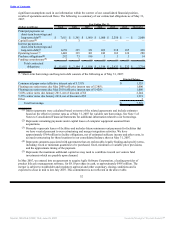
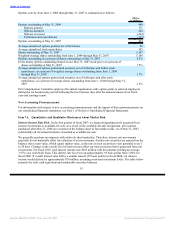
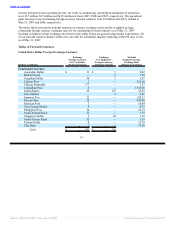
Options activity from June 1, 2004 through May 31, 2007 is summarized as follows:
(Shares
in millions)
Options outstanding at May 31, 2004 440
Options granted 171
Options assumed 204
Options exercised (264)
Forfeitures and cancellations (117)
Options outstanding at May 31, 2007 434
Average annualized options granted, net of forfeitures 86
Average annualized stock repurchases 165
Shares outstanding at May 31, 2007 5,107
Weighted-average shares outstanding from June 1, 2004 through May 31, 2007 5,168
Options outstanding as a percent of shares outstanding at May 31, 2007 8.5%
In the money options outstanding (based on our May 31, 2007 stock price) as a percent of
shares outstanding at May 31, 2007 7.5%
Average annualized options granted and assumed, net of forfeitures and before stock
repurchases, as a percent of weighted average shares outstanding from June 1, 2004
through May 31, 2007 1.7%
Average annualized options granted and assumed, net of forfeitures and after stock
repurchases, as a percent of average shares outstanding from June 1, 2004 through May 31,
2007 -1.5%
Our Compensation Committee approves the annual organization-wide option grants to selected employees
during the ten business-day period following the two business days after the announcement of our fiscal
year-end earnings report.
New Accounting Pronouncements
For information with respect to new accounting pronouncements and the impact of these pronouncements on
our consolidated financial statements, see Note 1 of Notes to Consolidated Financial Statements.
Item 7A. Quantitative and Qualitative Disclosures About Market Risk
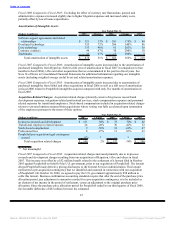
Interest Income Rate Risk. In the first quarter of fiscal 2007, we began designating newly acquired fixed
income investments as available-for-sale. As a result of the available-for-sale designation, all securities
purchased after May 31, 2006 are recorded on the balance sheet at fair market value. As of May 31, 2007,
substantially all investments held are classified as available-for-sale.
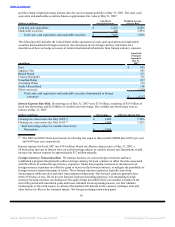
We generally purchase investments with relatively short maturities. Therefore, interest rate movements
generally do not materially affect the valuation of our investments. Auction rate securities are reported on the
balance sheet at par value, which equals market value, as the rate on such securities re-sets generally every 7
to 28 days. Changes in the overall level of interest rates affect our interest income that is generated from our
investments. For fiscal 2007, total interest income was $295 million with investments yielding an average
3.97% on a worldwide basis. This interest rate level was up approximately 93 basis points from 3.04% for
fiscal 2006. If overall interest rates fell by a similar amount (93 basis points) in fiscal 2008, our interest
income would decline by approximately $70 million, assuming consistent investment levels. The table below
presents the cash, cash equivalent and marketable securities balances
55
Source: ORACLE CORP, 10-K, June 29, 2007 Powered by Morningstar® Document Research℠