Oracle 2006 Annual Report Download - page 39
Download and view the complete annual report
Please find page 39 of the 2006 Oracle annual report below. You can navigate through the pages in the report by either clicking on the pages listed below, or by using the keyword search tool below to find specific information within the annual report.-
 1
1 -
2
-
3
-
4
-
5
-
6
-
7
-
8
-
9
-
10
-
11
-
12
-
13
-
14
-
15
-
16
-
17
-
18
-
19
-
20
-
21
-
22
-
23
-
24
-
25
-
26
-
27
-
28
-
 29
29 -
 30
30 -
 31
31 -
 32
32 -
 33
33 -
 34
34 -
 35
35 -
 36
36 -
 37
37 -
 38
38 -
 39
39 -
 40
40 -
 41
41 -
 42
42 -
 43
43 -
 44
44 -
 45
45 -
 46
46 -
 47
47 -
 48
48 -
 49
49 -
50
-
51
-
52
-
53
-
54
-
55
-
56
-
57
-
58
-
59
-
60
-
61
-
62
-
63
-
64
-
65
-
66
-
67
-
68
-
69
-
70
-
71
-
72
-
73
-
74
-
75
-
76
-
77
-
78
-
79
-
80
-
81
-
82
-
83
-
84
-
85
-
86
-
87
-
88
-
89
-
90
-
91
-
92
-
93
-
94
-
95
-
96
-
97
-
98
-
99
-
100
-
101
-
102
-
103
-
104
-
105
-
106
-
107
-
108
-
109
-
110
-
111
-
112
-
113
-
114
-
115
-
116
-
117
-
118
-
119
-
120
-
121
-
122
-
123
-
124
-
125
-
126
-
127
-
128
-
129
-
130
-
131
-
132
-
133
 |
 |

Table of Contents
last day of our prior fiscal year, rather than the actual exchange rates in effect during the respective periods.
For example, if an entity reporting in Euros had revenues of 1.0 million Euros from products sold on May 31,
2007 and May 31, 2006, our financial statements would reflect revenues of $1.35 million in fiscal 2007 (using
1.35 as the exchange rate) and $1.27 million in fiscal 2006 (using 1.27 as the exchange rate). The constant
currency presentation would translate the fiscal 2007 results using the fiscal 2006 exchange rate and indicate,
in this example, no change in revenues during the periods. In each of the tables below, we present the percent
change based on actual results as reported and based on constant currency.
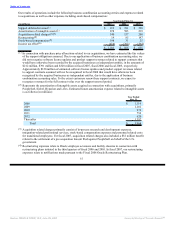
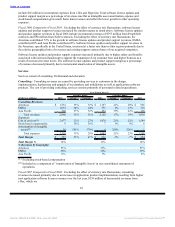
Total Revenues and Operating Expenses
Year Ended May 31,
Percent Change Percent Change
(Dollars in millions) 2007 Actual Constant 2006 Actual Constant 2005
Total Revenues by
Geography:
Americas $ 9,460 24% 23% $ 7,652 32% 31% $ 5,798
EMEA(1) 6,037 28% 20% 4,708 10% 15% 4,288
Asia Pacific 2,499 24% 21% 2,020 18% 21% 1,713
Total revenues 17,996 25% 22% 14,380 22% 23% 11,799
Total Operating Expenses 12,022 25% 22% 9,644 24% 25% 7,777
Total Operating Margin $ 5,974 26% 21% $ 4,736 18% 20% $ 4,022
Total Operating Margin% 33% 33% 34%
% Revenues by
Geography:
Americas 53% 53% 49%
EMEA 34% 33% 36%
Asia Pacific 13% 14% 15%
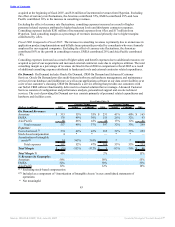
Total Revenues by
Business:
Software $ 14,211 23% 20% $ 11,541 23% 24% $ 9,421
Services 3,785 33% 29% 2,839 19% 21% 2,378
Total revenues $ 17,996 25% 22% $ 14,380 22% 23% $ 11,799
% Revenues by Business:
Software 79% 80% 80%
Services 21% 20% 20%
(1) Comprised of Europe, the Middle East and Africa
Fiscal 2007 Compared to Fiscal 2006: Total revenues increased in fiscal 2007 due to increased demand for
our products and services offerings, strong sales execution, and incremental revenues from our acquisitions.
Total revenues were positively affected by foreign currency rate fluctuations of 3 percentage points in fiscal
2007 due to the weakening of the United States dollar relative to other major international currencies.
Excluding the effects of currency rate fluctuations, new software license revenues contributed 27% to the
growth in total revenues, software license updates and product support revenues contributed 47% and services
contributed 26%. Excluding the effect of currency rate fluctuations, the Americas contributed 56% to the
increase in total revenues, EMEA contributed 30% and Asia Pacific contributed 14%.
Excluding the effect of currency rate fluctuations, the increase in operating expenses is primarily due to
higher salary and employee benefits associated with increased headcount levels (primarily resulting from our
acquisitions in fiscal 2007 and fiscal 2006), as well as higher commissions and travel and entertainment
expenses associated with both increased revenues and headcount levels. In addition, operating expenses also
increased in fiscal 2007 due to higher amortization costs of intangible assets and stock-based compensation
expenses related to our adoption of Statement 123R. Operating expenses were negatively affected by foreign
currency rate fluctuations of 3 percentage
35
Source: ORACLE CORP, 10-K, June 29, 2007 Powered by Morningstar® Document Research℠