Oracle 2006 Annual Report Download - page 58
Download and view the complete annual report
Please find page 58 of the 2006 Oracle annual report below. You can navigate through the pages in the report by either clicking on the pages listed below, or by using the keyword search tool below to find specific information within the annual report.-
 1
1 -
2
-
3
-
4
-
5
-
6
-
7
-
8
-
9
-
10
-
11
-
12
-
13
-
14
-
15
-
16
-
17
-
18
-
19
-
20
-
21
-
22
-
23
-
24
-
25
-
26
-
27
-
28
-
29
-
30
-
31
-
32
-
33
-
34
-
35
-
36
-
37
-
38
-
39
-
40
-
41
-
42
-
43
-
44
-
45
-
46
-
47
-
 48
48 -
 49
49 -
 50
50 -
 51
51 -
 52
52 -
 53
53 -
 54
54 -
 55
55 -
 56
56 -
 57
57 -
 58
58 -
 59
59 -
 60
60 -
 61
61 -
 62
62 -
 63
63 -
 64
64 -
 65
65 -
 66
66 -
 67
67 -
 68
68 -
69
-
70
-
71
-
72
-
73
-
74
-
75
-
76
-
77
-
78
-
79
-
80
-
81
-
82
-
83
-
84
-
85
-
86
-
87
-
88
-
89
-
90
-
91
-
92
-
93
-
94
-
95
-
96
-
97
-
98
-
99
-
100
-
101
-
102
-
103
-
104
-
105
-
106
-
107
-
108
-
109
-
110
-
111
-
112
-
113
-
114
-
115
-
116
-
117
-
118
-
119
-
120
-
121
-
122
-
123
-
124
-
125
-
126
-
127
-
128
-
129
-
130
-
131
-
132
-
133
 |
 |

Table of Contents
decrease in our first quarter revenues as compared to revenues in the immediately preceding fourth quarter,
which historically has been the highest revenue quarter. We expect this trend to continue in the first quarter of
fiscal 2008. In addition, our European operations generally provide lower revenues in our first fiscal quarter
because of the reduced economic activity in Europe during the summer.
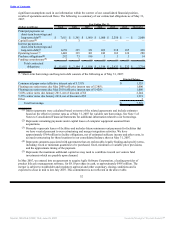
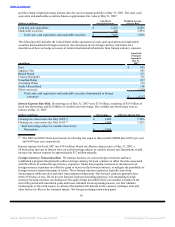
The following table sets forth selected unaudited quarterly information for our last eight fiscal quarters. We
believe that all necessary adjustments, which consisted only of normal recurring adjustments, have been
included in the amounts stated below to present fairly the results of such periods when read in conjunction
with the consolidated financial statements and related notes included elsewhere in this Annual Report on
Form 10-K. The sum of the quarterly financial information may vary from the annual data due to rounding.
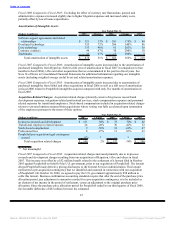
Fiscal 2007 Quarter Ended (Unaudited)
(in millions, except per share amounts) August 31 November 30 February 28 May 31
Revenues $ 3,591 $ 4,163 $ 4,414 $ 5,828
Gross profit $ 1,666 $ 2,024 $ 2,197 $ 3,143
Operating income $ 943 $ 1,357 $ 1,394 $ 2,281
Net income $ 670 $ 967 $ 1,033 $ 1,604
Earnings per share—basic $ 0.13 $ 0.19 $ 0.20 $ 0.31
Earnings per share—diluted $ 0.13 $ 0.18 $ 0.20 $ 0.31
Fiscal 2006 Quarter Ended (Unaudited)
(in millions, except per share amounts) August 31 November 30 February 28 May 31
Revenues $ 2,768 $ 3,292 $ 3,470 $ 4,851
Gross profit $ 1,311 $ 1,705 $ 1,779 $ 2,606
Operating income $ 712 $ 1,116 $ 1,052 $ 1,857
Net income $ 519 $ 798 $ 765 $ 1,300
Earnings per share—basic $ 0.10 $ 0.15 $ 0.15 $ 0.25
Earnings per share—diluted $ 0.10 $ 0.15 $ 0.14 $ 0.24
Stock Options
Our stock option program is a key component of the compensation package we provide to attract and retain
talented employees and align their interests with the interests of existing stockholders. We recognize that
options dilute existing stockholders and have sought to control the number of options granted while providing
competitive compensation packages. Consistent with these dual goals, our cumulative potential dilution for
each of the last three full fiscal years has been less than 2.0% and has averaged 1.7% per year. The potential
dilution percentage is calculated as the new option grants for the year (including options assumed in
acquisitions), net of options forfeited by employees leaving the company, divided by the total outstanding
shares at the beginning of the year. This maximum potential dilution will only result if all options are
exercised. Some of these options, which have 10-year exercise periods, have exercise prices substantially
higher than the current market price. At May 31, 2007, 12% of our outstanding stock options had exercise
prices in excess of the current market price. Consistent with our historical practices, we do not expect that
dilution from future grants before the effect of our stock repurchase program will exceed 2.0% per year for
our ongoing business. Over the last 10 years, our stock repurchase program has more than offset the dilutive
effect of our stock option program; however, we may reduce the level of our stock repurchases in the future as
we may use our available cash for acquisitions, to repay indebtedness or for other purposes. At May 31, 2007,
the maximum potential dilution from all outstanding and unexercised option awards, regardless of when
granted and regardless of whether vested or unvested and including options where the strike price is higher
than the current market price, was 8.5%.
The Compensation Committee of the Board of Directors reviews and approves the organization-wide stock
option grants to selected employees, all stock option grants to executive officers and any individual stock
option grants in excess of 100,000 shares. A separate Plan Committee, which is an executive officer
committee, approves individual stock option grants of up to 100,000 shares to non-executive officers and
employees.
54
Source: ORACLE CORP, 10-K, June 29, 2007 Powered by Morningstar® Document Research℠