Oracle 2006 Annual Report Download - page 27
Download and view the complete annual report
Please find page 27 of the 2006 Oracle annual report below. You can navigate through the pages in the report by either clicking on the pages listed below, or by using the keyword search tool below to find specific information within the annual report.-
 1
1 -
2
-
3
-
4
-
5
-
6
-
7
-
8
-
9
-
10
-
11
-
12
-
13
-
14
-
15
-
16
-
 17
17 -
 18
18 -
 19
19 -
 20
20 -
 21
21 -
 22
22 -
 23
23 -
 24
24 -
 25
25 -
 26
26 -
 27
27 -
 28
28 -
 29
29 -
 30
30 -
 31
31 -
 32
32 -
 33
33 -
 34
34 -
 35
35 -
 36
36 -
 37
37 -
38
-
39
-
40
-
41
-
42
-
43
-
44
-
45
-
46
-
47
-
48
-
49
-
50
-
51
-
52
-
53
-
54
-
55
-
56
-
57
-
58
-
59
-
60
-
61
-
62
-
63
-
64
-
65
-
66
-
67
-
68
-
69
-
70
-
71
-
72
-
73
-
74
-
75
-
76
-
77
-
78
-
79
-
80
-
81
-
82
-
83
-
84
-
85
-
86
-
87
-
88
-
89
-
90
-
91
-
92
-
93
-
94
-
95
-
96
-
97
-
98
-
99
-
100
-
101
-
102
-
103
-
104
-
105
-
106
-
107
-
108
-
109
-
110
-
111
-
112
-
113
-
114
-
115
-
116
-
117
-
118
-
119
-
120
-
121
-
122
-
123
-
124
-
125
-
126
-
127
-
128
-
129
-
130
-
131
-
132
-
133
 |
 |
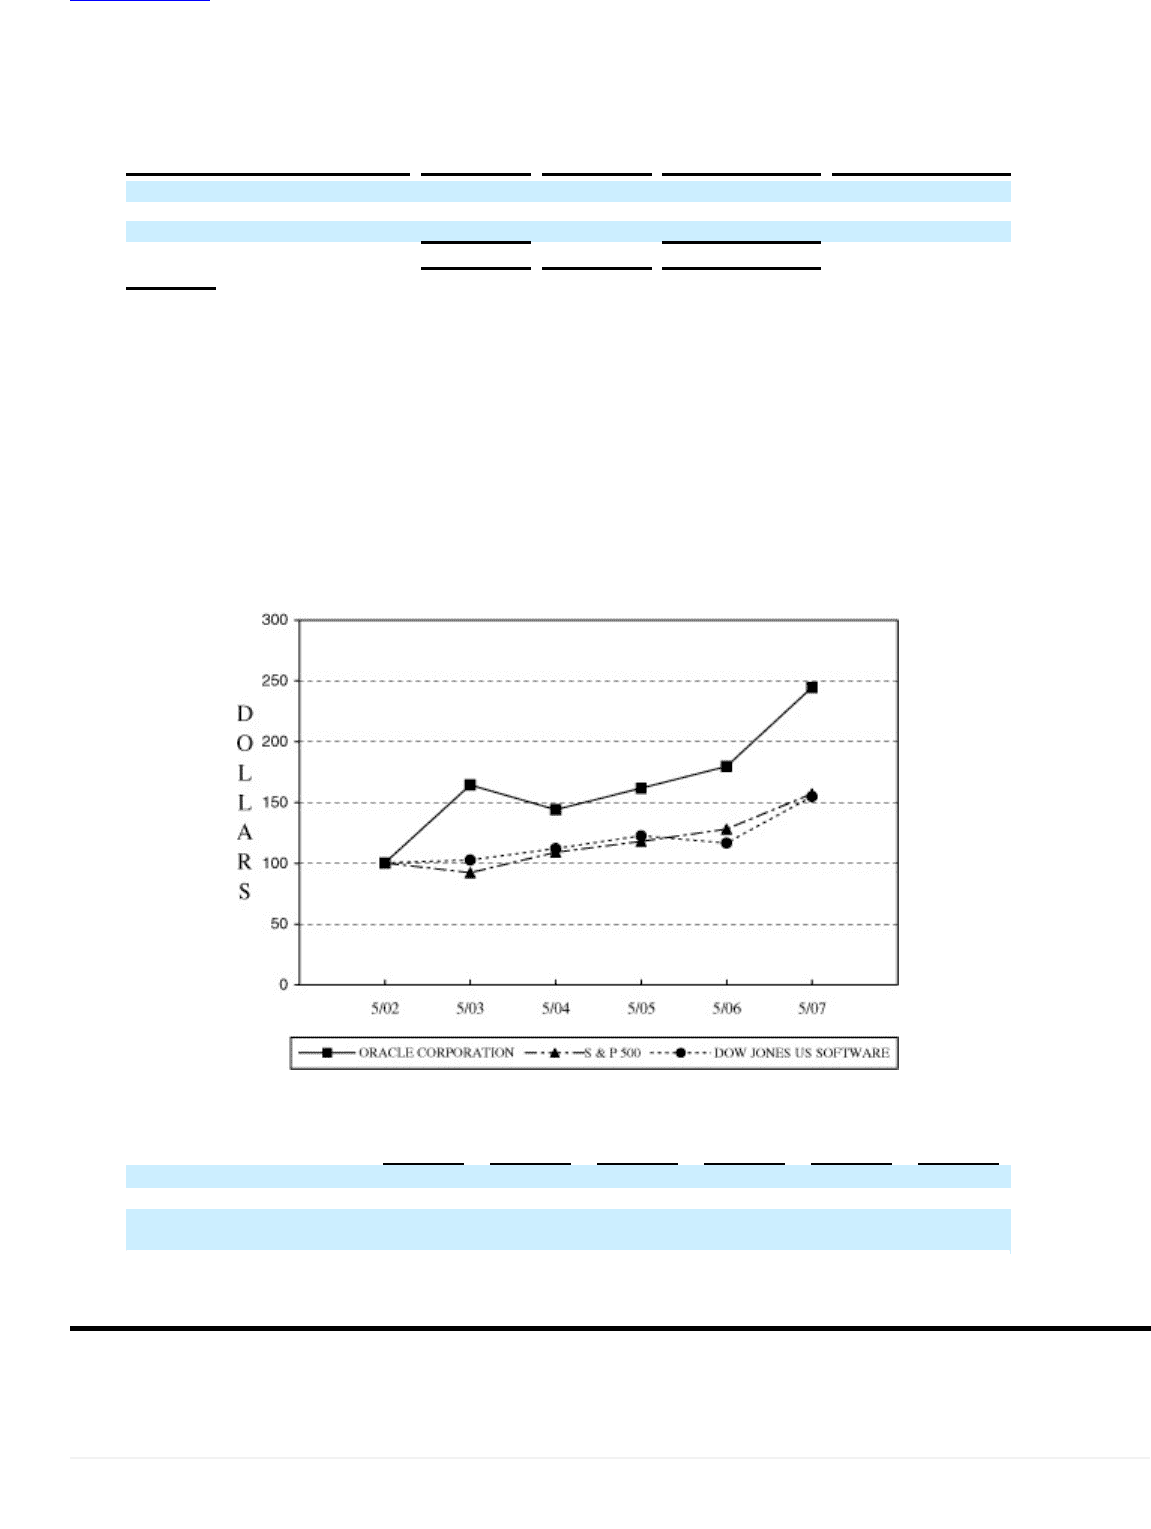
Table of Contents
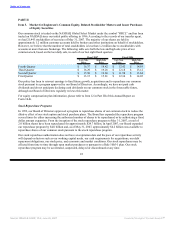
The following table summarizes the stock repurchase activity for the three months ending May 31, 2007 and
the approximate dollar value of shares that may yet be purchased pursuant to our share repurchase programs:
Total Number of
Shares Purchased as Approximate Dollar
Total Number Average Price Part of Publicly Value of Shares that
of Shares Paid Per Announced May Yet Be Purchased
(in millions, except per share amounts) Purchased Share Programs Under the Programs(1)
March 1, 2007 - March 31, 2007 19.8 $ 17.32 19.8 $ 864.9
April 1, 2007 - April 30, 2007 16.7 $ 18.73 16.7 $ 4,552.3
May 1, 2007 - May 31, 2007 18.0 $ 19.02 18.0 $ 4,209.0
Total 54.5 $ 18.32 54.5
(1) In April 2007, our Board of Directors authorized the expansion of our repurchase program by $4.0 billion.
Stock Performance Graphs and Cumulative Total Return
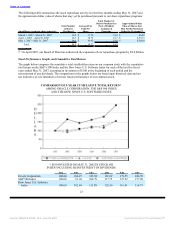
The graph below compares the cumulative total stockholder return on our common stock with the cumulative
total return on the S&P’s 500 Index and the Dow Jones U.S. Software Index for each of the last five fiscal
years ended May 31, 2007, assuming an investment of $100 at the beginning of such period and the
reinvestment of any dividends. The comparisons in the graphs below are based upon historical data and are
not indicative of, nor intended to forecast, future performance of our common stock.
COMPARISON OF 5-YEAR CUMULATIVE TOTAL RETURN*
AMONG ORACLE CORPORATION, THE S&P 500 INDEX
AND THE DOW JONES U.S. SOFTWARE INDEX
* $100 INVESTED ON MAY 31, 2002 IN STOCK OR
INDEX-INCLUDING REINVESTMENT OF DIVIDENDS.
5/02 5/03 5/04 5/05 5/06 5/07
Oracle Corporation 100.00 164.27 143.94 161.62 179.55 244.70
S&P 500 Index 100.00 91.94 108.79 117.75 127.92 157.08
Dow Jones U.S. Software
Index 100.00 102.44 111.89 122.40 116.41 154.75
23
Source: ORACLE CORP, 10-K, June 29, 2007 Powered by Morningstar® Document Research℠