Oracle 2006 Annual Report Download - page 40
Download and view the complete annual report
Please find page 40 of the 2006 Oracle annual report below. You can navigate through the pages in the report by either clicking on the pages listed below, or by using the keyword search tool below to find specific information within the annual report.-
 1
1 -
2
-
3
-
4
-
5
-
6
-
7
-
8
-
9
-
10
-
11
-
12
-
13
-
14
-
15
-
16
-
17
-
18
-
19
-
20
-
21
-
22
-
23
-
24
-
25
-
26
-
27
-
28
-
29
-
 30
30 -
 31
31 -
 32
32 -
 33
33 -
 34
34 -
 35
35 -
 36
36 -
 37
37 -
 38
38 -
 39
39 -
 40
40 -
 41
41 -
 42
42 -
 43
43 -
 44
44 -
 45
45 -
 46
46 -
 47
47 -
 48
48 -
 49
49 -
 50
50 -
51
-
52
-
53
-
54
-
55
-
56
-
57
-
58
-
59
-
60
-
61
-
62
-
63
-
64
-
65
-
66
-
67
-
68
-
69
-
70
-
71
-
72
-
73
-
74
-
75
-
76
-
77
-
78
-
79
-
80
-
81
-
82
-
83
-
84
-
85
-
86
-
87
-
88
-
89
-
90
-
91
-
92
-
93
-
94
-
95
-
96
-
97
-
98
-
99
-
100
-
101
-
102
-
103
-
104
-
105
-
106
-
107
-
108
-
109
-
110
-
111
-
112
-
113
-
114
-
115
-
116
-
117
-
118
-
119
-
120
-
121
-
122
-
123
-
124
-
125
-
126
-
127
-
128
-
129
-
130
-
131
-
132
-
133
 |
 |

Table of Contents
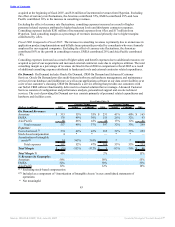
points. The aforementioned increases in operating expenses were partially offset by lower restructuring
expenses and the settlement of a pre-acquisition PeopleSoft related contingency that benefited our operating
expenses (see Acquisition Related Charges discussion below).
Operating margins as a percentage of total revenues were flat in fiscal 2007 and were favorably affected by
foreign currency rate fluctuations of 5 percentage points. Our revenues grew at a faster rate than our operating
expenses, excluding amortization costs of intangible assets and stock-based compensation expenses. The
increases in those cost categories offset the slower growth in other operating expenses.
International operations will continue to provide a significant portion of our total revenues. As a result, total
revenues and expenses will be affected by changes in the relative strength of the United States dollar against
certain major international currencies.
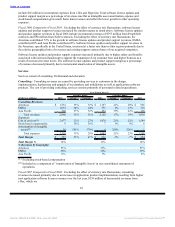
Fiscal 2006 Compared to Fiscal 2005: Total revenues increased in fiscal 2006 due to strong sales execution,
incremental revenues from acquisitions and a strengthening in our competitive position. Excluding the effect
of currency rate fluctuations, software license updates and product support revenues contributed 50% to the
growth in total revenues, new software licenses contributed 32% and services revenues contributed 18%.
Excluding the effects of currency rate fluctuations, the Americas contributed 65% to the increase in total
revenues, EMEA contributed 22% and Asia Pacific contributed 13%. Total revenues in the Americas,
specifically in the United States, increased at a faster rate than in other regions primarily due to the relative
geographical mix of revenues from our acquired companies.
Operating expenses were favorably affected by 1 percentage point as a result of the strengthening of the
United States dollar relative to other major international currencies. Excluding the effect of currency rate
fluctuations, the increase in operating expenses is primarily due to higher headcount levels and associated
personnel related costs in sales and marketing, consulting and research and development, higher commissions
due to the increase in revenues and greater amortization of intangible assets, offset partially by lower
restructuring and acquisition related expenses. Operating margins as a percentage of total revenues decreased
slightly in fiscal 2006 due to higher costs associated with acquisitions, principally amortization of intangible
assets.
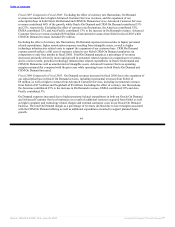
Supplemental Disclosure Related to Acquisition Accounting and Stock-Based Compensation
To supplement our consolidated financial information we believe the following information is helpful to an
overall understanding of our past financial performance and prospects for the future. You should review the
introduction under “Results of Operations” (above) for a discussion of the inherent limitations in comparing
pre- and post-acquisition information.
36
Source: ORACLE CORP, 10-K, June 29, 2007 Powered by Morningstar® Document Research℠