Oracle 2006 Annual Report Download - page 49
Download and view the complete annual report
Please find page 49 of the 2006 Oracle annual report below. You can navigate through the pages in the report by either clicking on the pages listed below, or by using the keyword search tool below to find specific information within the annual report.-
 1
1 -
2
-
3
-
4
-
5
-
6
-
7
-
8
-
9
-
10
-
11
-
12
-
13
-
14
-
15
-
16
-
17
-
18
-
19
-
20
-
21
-
22
-
23
-
24
-
25
-
26
-
27
-
28
-
29
-
30
-
31
-
32
-
33
-
34
-
35
-
36
-
37
-
38
-
 39
39 -
 40
40 -
 41
41 -
 42
42 -
 43
43 -
 44
44 -
 45
45 -
 46
46 -
 47
47 -
 48
48 -
 49
49 -
 50
50 -
 51
51 -
 52
52 -
 53
53 -
 54
54 -
 55
55 -
 56
56 -
 57
57 -
 58
58 -
 59
59 -
60
-
61
-
62
-
63
-
64
-
65
-
66
-
67
-
68
-
69
-
70
-
71
-
72
-
73
-
74
-
75
-
76
-
77
-
78
-
79
-
80
-
81
-
82
-
83
-
84
-
85
-
86
-
87
-
88
-
89
-
90
-
91
-
92
-
93
-
94
-
95
-
96
-
97
-
98
-
99
-
100
-
101
-
102
-
103
-
104
-
105
-
106
-
107
-
108
-
109
-
110
-
111
-
112
-
113
-
114
-
115
-
116
-
117
-
118
-
119
-
120
-
121
-
122
-
123
-
124
-
125
-
126
-
127
-
128
-
129
-
130
-
131
-
132
-
133
 |
 |

Table of Contents
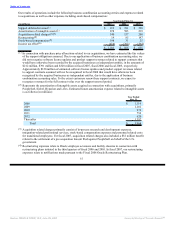
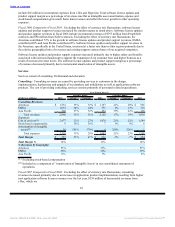
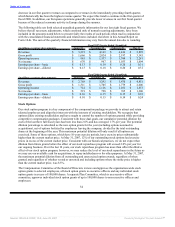
Education: Education revenues are earned by providing instructor led, media based and internet based
training in the use of our database and middleware as well as applications software. Education expenses
primarily consist of personnel related expenditures, facilities and external contractor costs.
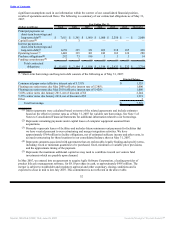
Year Ended May 31,
Percent Change Percent Change
(Dollars in millions) 2007 Actual Constant 2006 Actual Constant 2005
Education Revenues:
Americas $ 164 9% 8% $ 151 34% 32% $ 113
EMEA 132 13% 6% 117 8% 13% 108
Asia Pacific 63 16% 14% 54 13% 15% 48
Total revenues 359 11% 8% 322 20% 21% 269
Expenses:
Cost of services(1) 283 15% 11% 246 10% 11% 224
Stock-based compensation 2 * * — -100% -100% 1
Total expenses 285 16% 12% 246 10% 11% 225
Total Margin $ 74 -2% -5% $ 76 69% 73% $ 44
Total Margin % 21% 24% 16%
% Revenues by Geography:
Americas 46% 47% 42%
EMEA 37% 36% 40%
Asia Pacific 17% 17% 18%
(1) Excluding stock-based compensation
* Not meaningful
Fiscal 2007 Compared to Fiscal 2006: Excluding the effect of currency rate fluctuations, education revenues
grew primarily due to an increase in customer training on the use of our application products, as well as
$5 million of incremental revenues from our acquisition of Hyperion. The Americas contributed 46%, EMEA
contributed 26% and Asia Pacific contributed 28% to the increase in education revenues.
Excluding the effects of currency rate fluctuations, education expenses increased due to incremental
headcount and associated personnel related expenditures, as well as higher third party contractor and royalty
fees associated with increased revenues. Education expenses also include $3 million of incremental expenses
from Hyperion. Total education margin as a percentage of revenues decreased as expenses grew at a higher
rate than revenues.
Fiscal 2006 Compared to Fiscal 2005: Education revenues increased due to an increase in customer training
on the use of our acquired applications products. Excluding the effect of currency rate fluctuations, the
Americas contributed 64%, EMEA contributed 24% and Asia Pacific contributed 12% to the overall increase
in education revenues.
Education expenses increased due to incremental headcount and associated personnel related expenditures
related to Siebel education employees and higher external contractor costs.
Research and Development Expenses: Research and development expenses consist primarily of personnel
related expenditures. We intend to continue to invest significantly in our research and development efforts
because, in our judgment, they are essential to maintaining our competitive position.
45
Source: ORACLE CORP, 10-K, June 29, 2007 Powered by Morningstar® Document Research℠