Oracle 2006 Annual Report Download - page 110
Download and view the complete annual report
Please find page 110 of the 2006 Oracle annual report below. You can navigate through the pages in the report by either clicking on the pages listed below, or by using the keyword search tool below to find specific information within the annual report.-
 1
1 -
2
-
3
-
4
-
5
-
6
-
7
-
8
-
9
-
10
-
11
-
12
-
13
-
14
-
15
-
16
-
17
-
18
-
19
-
20
-
21
-
22
-
23
-
24
-
25
-
26
-
27
-
28
-
29
-
30
-
31
-
32
-
33
-
34
-
35
-
36
-
37
-
38
-
39
-
40
-
41
-
42
-
43
-
44
-
45
-
46
-
47
-
48
-
49
-
50
-
51
-
52
-
53
-
54
-
55
-
56
-
57
-
58
-
59
-
60
-
61
-
62
-
63
-
64
-
65
-
66
-
67
-
68
-
69
-
70
-
71
-
72
-
73
-
74
-
75
-
76
-
77
-
78
-
79
-
80
-
81
-
82
-
83
-
84
-
85
-
86
-
87
-
88
-
89
-
90
-
91
-
92
-
93
-
94
-
95
-
96
-
97
-
98
-
99
-
 100
100 -
 101
101 -
 102
102 -
 103
103 -
 104
104 -
 105
105 -
 106
106 -
 107
107 -
 108
108 -
 109
109 -
 110
110 -
 111
111 -
 112
112 -
 113
113 -
 114
114 -
 115
115 -
 116
116 -
 117
117 -
 118
118 -
 119
119 -
 120
120 -
121
-
122
-
123
-
124
-
125
-
126
-
127
-
128
-
129
-
130
-
131
-
132
-
133
 |
 |

Table of Contents
ORACLE CORPORATION
NOTES TO CONSOLIDATED FINANCIAL STATEMENTS—(Continued)
May 31, 2007
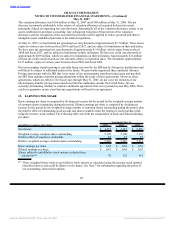
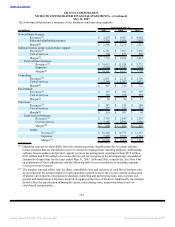
The following table presents a summary of our businesses and operating segments:
Year Ended May 31,
(in millions) 2007 2006 2005
New software licenses:
Revenues(1) $ 5,874 $ 4,897 $ 4,082
Sales and distribution expenses 3,326 2,638 2,055
Margin(2) $ 2,548 $ 2,259 $ 2,027
Software license updates and product support:
Revenues(1) $ 8,541 $ 7,027 $ 5,650
Cost of services 788 673 569
Margin(2) $ 7,753 $ 6,354 $ 5,081
Total software business:
Revenues(1) $ 14,415 $ 11,924 $ 9,732
Expenses 4,114 3,311 2,624
Margin(2) $ 10,301 $ 8,613 $ 7,108
Consulting:
Revenues(1) $ 2,851 $ 2,113 $ 1,796
Cost of services 2,384 1,787 1,471
Margin(2) $ 467 $ 326 $ 325
On Demand:
Revenues(1) $ 555 $ 398 $ 307
Cost of services 529 372 274
Margin(2) $ 26 $ 26 $ 33
Education:
Revenues(1) $ 387 $ 336 $ 284
Cost of services 272 235 215
Margin(2) $ 115 $ 101 $ 69
Total services business:
Revenues(1) $ 3,793 $ 2,847 $ 2,387
Cost of services 3,185 2,394 1,960
Margin(2) $ 608 $ 453 $ 427
Totals:
Revenues(1) $ 18,208 $ 14,771 $ 12,119
Expenses 7,299 5,705 4,584
Margin(2) $ 10,909 $ 9,066 $ 7,535
(1) Operating segment revenues differ from the external reporting classifications due to certain software
license products that are classified as service revenues for management reporting purposes. Additionally,
software license updates and product support revenues for management reporting include $212 million,
$391 million and $320 million of revenues that we did not recognize in the accompanying consolidated
statements of operations for the years ended May 31, 2007, 2006 and 2005, respectively. See Note 6 for
an explanation of these adjustments and the following table for a reconciliation of operating segment
revenues to total revenues.
(2) The margins reported reflect only the direct controllable costs and expenses of each line of business and
do not represent the actual margins for each operating segment because they do not contain an allocation
of product development, information technology, marketing and partner programs, and corporate and
general and administrative expenses incurred in support of the lines of business. Additionally, the margins
do not reflect the amortization of intangible assets, restructuring costs, acquisition related costs or
stock-based compensation.
103
Source: ORACLE CORP, 10-K, June 29, 2007 Powered by Morningstar® Document Research℠