Oracle 2006 Annual Report Download - page 43
Download and view the complete annual report
Please find page 43 of the 2006 Oracle annual report below. You can navigate through the pages in the report by either clicking on the pages listed below, or by using the keyword search tool below to find specific information within the annual report.-
 1
1 -
2
-
3
-
4
-
5
-
6
-
7
-
8
-
9
-
10
-
11
-
12
-
13
-
14
-
15
-
16
-
17
-
18
-
19
-
20
-
21
-
22
-
23
-
24
-
25
-
26
-
27
-
28
-
29
-
30
-
31
-
32
-
 33
33 -
 34
34 -
 35
35 -
 36
36 -
 37
37 -
 38
38 -
 39
39 -
 40
40 -
 41
41 -
 42
42 -
 43
43 -
 44
44 -
 45
45 -
 46
46 -
 47
47 -
 48
48 -
 49
49 -
 50
50 -
 51
51 -
 52
52 -
 53
53 -
54
-
55
-
56
-
57
-
58
-
59
-
60
-
61
-
62
-
63
-
64
-
65
-
66
-
67
-
68
-
69
-
70
-
71
-
72
-
73
-
74
-
75
-
76
-
77
-
78
-
79
-
80
-
81
-
82
-
83
-
84
-
85
-
86
-
87
-
88
-
89
-
90
-
91
-
92
-
93
-
94
-
95
-
96
-
97
-
98
-
99
-
100
-
101
-
102
-
103
-
104
-
105
-
106
-
107
-
108
-
109
-
110
-
111
-
112
-
113
-
114
-
115
-
116
-
117
-
118
-
119
-
120
-
121
-
122
-
123
-
124
-
125
-
126
-
127
-
128
-
129
-
130
-
131
-
132
-
133
 |
 |

Table of Contents
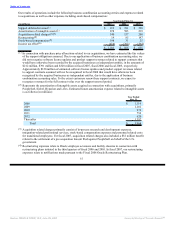
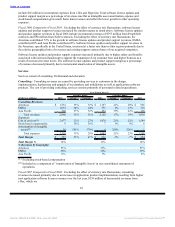
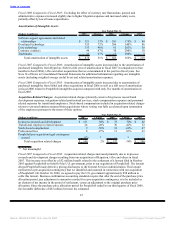
Software
Software includes new software licenses and software license updates and product support.
New Software Licenses: New software license revenues represent fees earned from granting customers
licenses to use our database and middleware as well as our application software products. We continue to
place significant emphasis, both domestically and internationally, on direct sales through our own sales force.
We also continue to market our products through indirect channels.
Year Ended May 31,
Percent Change Percent Change
(Dollars in millions) 2007 Actual Constant 2006 Actual Constant 2005
New Software License
Revenues:
Americas $ 2,751 18% 18% $ 2,323 29% 27% $ 1,805
EMEA 2,043 24% 16% 1,650 10% 14% 1,505
Asia Pacific 1,088 17% 15% 932 19% 22% 781
Total revenues 5,882 20% 17% 4,905 20% 21% 4,091
Expenses:
Sales and marketing(1) 3,869 22% 18% 3,169 27% 27% 2,505
Stock-based compensation 38 388% 388% 8 33% 33% 6
Amortization of intangible
assets(2) 354 70% 70% 208 251% 251% 59
Total expenses 4,261 26% 23% 3,385 32% 33% 2,570
Total Margin $ 1,621 7% 3% $ 1,520 0% 2% $ 1,521
Total Margin % 28% 31% 37%
% Revenues by Geography:
Americas 47% 47% 44%
EMEA 35% 34% 37%
Asia Pacific 18% 19% 19%
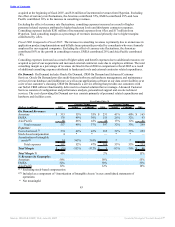
Revenues by Product:
Database and middleware $ 4,119 15% 12% $ 3,566 9% 11% $ 3,265
Applications 1,716 32% 29% 1,303 66% 67% 785
Total revenues by product 5,835 20% 17% 4,869 20% 21% 4,050
Other revenues 47 31% 29% 36 -13% -12% 41
Total new software license
revenues $ 5,882 20% 17% $ 4,905 20% 21% $ 4,091
% Revenues by Product:
Database and middleware 71% 73% 81%
Applications 29% 27% 19%
(1) Excluding stock-based compensation
(2) Included as a component of ‘Amortization of Intangible Assets’ in our consolidated statements of
operations
Fiscal 2007 Compared to Fiscal 2006: Excluding the effect of currency rate fluctuations, new software
license revenues grew in all major product lines and across all geographies. Database and middleware
revenues contributed 57% to the increase in new software license revenues, while applications revenues
contributed 43%. The Americas contributed 50%, EMEA contributed 33% and Asia Pacific contributed 17%
to the increase in new software license revenues.
39
Source: ORACLE CORP, 10-K, June 29, 2007 Powered by Morningstar® Document Research℠