Oracle 2006 Annual Report Download - page 55
Download and view the complete annual report
Please find page 55 of the 2006 Oracle annual report below. You can navigate through the pages in the report by either clicking on the pages listed below, or by using the keyword search tool below to find specific information within the annual report.-
 1
1 -
2
-
3
-
4
-
5
-
6
-
7
-
8
-
9
-
10
-
11
-
12
-
13
-
14
-
15
-
16
-
17
-
18
-
19
-
20
-
21
-
22
-
23
-
24
-
25
-
26
-
27
-
28
-
29
-
30
-
31
-
32
-
33
-
34
-
35
-
36
-
37
-
38
-
39
-
40
-
41
-
42
-
43
-
44
-
 45
45 -
 46
46 -
 47
47 -
 48
48 -
 49
49 -
 50
50 -
 51
51 -
 52
52 -
 53
53 -
 54
54 -
 55
55 -
 56
56 -
 57
57 -
 58
58 -
 59
59 -
 60
60 -
 61
61 -
 62
62 -
 63
63 -
 64
64 -
 65
65 -
66
-
67
-
68
-
69
-
70
-
71
-
72
-
73
-
74
-
75
-
76
-
77
-
78
-
79
-
80
-
81
-
82
-
83
-
84
-
85
-
86
-
87
-
88
-
89
-
90
-
91
-
92
-
93
-
94
-
95
-
96
-
97
-
98
-
99
-
100
-
101
-
102
-
103
-
104
-
105
-
106
-
107
-
108
-
109
-
110
-
111
-
112
-
113
-
114
-
115
-
116
-
117
-
118
-
119
-
120
-
121
-
122
-
123
-
124
-
125
-
126
-
127
-
128
-
129
-
130
-
131
-
132
-
133
 |
 |

Table of Contents
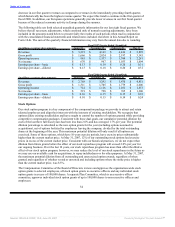
Fiscal 2006 Compared to Fiscal 2005: Cash used for investing activities decreased in fiscal 2006 primarily
due to lower cash payments for acquisitions, net of cash acquired, as well as proceeds from property sales.
Investing cash outflows in fiscal 2005 include cash paid for our acquisition of PeopleSoft, whereas investing
cash outflows in fiscal 2006 primarily relate to our acquisition of Siebel and our equity investment purchases
in i-flex.
Cash flows from financing activities: The changes in cash flows from financing activities primarily relate to
borrowings and payments under debt obligations as well as stock repurchase and stock option exercise
activity.
Fiscal 2007 Compared to Fiscal 2006: Net cash used for financing activities in fiscal 2007 primarily relates
to an increase in stock repurchases and lower borrowings net of repayments when compared with the prior
year. At May 31, 2007 we had approximately $4.2 billion available for share repurchases pursuant to a
program authorized by our Board of Directors and we intend to continue to repurchase shares pursuant to this
program.
Fiscal 2006 Compared to Fiscal 2005: Cash provided by financing activities decreased in fiscal 2006
primarily due to higher stock repurchases, partially offset by higher net borrowings. We increased our share
repurchases in fiscal 2006 due to the issuance of approximately 141 million shares of common stock in
connection with our Siebel acquisition.
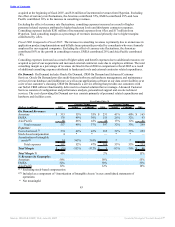
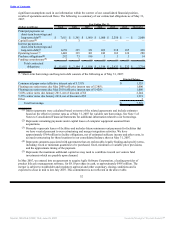
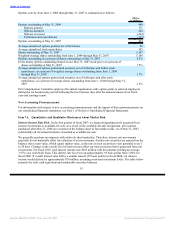
Free cash flow: To supplement our statements of cash flows presented on a GAAP basis, we use non-GAAP
measures of cash flows on a trailing 4-quarter basis to analyze cash flow generated from operations. We
believe free cash flow is also useful as one of the bases for comparing our performance with our competitors.
The presentation of non-GAAP free cash flow is not meant to be considered in isolation or as an alternative to
net income as an indicator of our performance, or as an alternative to cash flows from operating activities as a
measure of liquidity. We calculate free cash flows as follows:
Year Ended May 31,
(Dollars in millions) 2007 Change 2006 Change 2005
Cash provided by operating activities $ 5,520 22% $ 4,541 28% $ 3,552
Capital expenditures(1) $ (319) 35% $ (236) 26% $ (188)
Free cash flow $ 5,201 21% $ 4,305 28% $ 3,364
Net income $ 4,274 26% $ 3,381 17% $ 2,886
Free cash flow as a percent of net income 122% 127% 117%
(1) Represents capital expenditures as reported in cash flows from investing activities in our consolidated
statements of cash flows presented in accordance with U.S. generally accepted accounting principles.
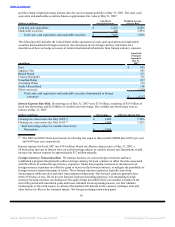
Long-Term Customer Financing
In fiscal 2007, 2006 and 2005, $891 million, $618 million and $456 million or approximately 15%, 13% and
11%, respectively, of our new software license revenues were financed through our financing division. We
generally sell contracts that we have financed on a non-recourse basis to financial institutions. We record the
transfers of amounts due from customers to financial institutions as sales of financial assets because we are
considered to have surrendered control of these financial assets.
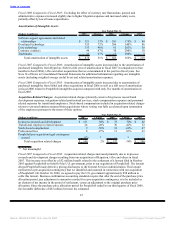
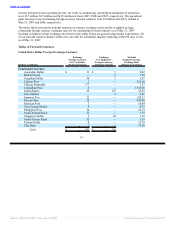
Contractual Obligations
The contractual obligations presented in the table below represent our estimates of future payments under
fixed contractual obligations and commitments. Changes in our business needs, cancellation provisions,
changing interest rates and other factors may result in actual payments differing from these estimates. We
cannot provide certainty regarding the timing and amounts of payments. We have presented below a summary
of the most
51
Source: ORACLE CORP, 10-K, June 29, 2007 Powered by Morningstar® Document Research℠