Oracle 2006 Annual Report Download - page 111
Download and view the complete annual report
Please find page 111 of the 2006 Oracle annual report below. You can navigate through the pages in the report by either clicking on the pages listed below, or by using the keyword search tool below to find specific information within the annual report.-
 1
1 -
2
-
3
-
4
-
5
-
6
-
7
-
8
-
9
-
10
-
11
-
12
-
13
-
14
-
15
-
16
-
17
-
18
-
19
-
20
-
21
-
22
-
23
-
24
-
25
-
26
-
27
-
28
-
29
-
30
-
31
-
32
-
33
-
34
-
35
-
36
-
37
-
38
-
39
-
40
-
41
-
42
-
43
-
44
-
45
-
46
-
47
-
48
-
49
-
50
-
51
-
52
-
53
-
54
-
55
-
56
-
57
-
58
-
59
-
60
-
61
-
62
-
63
-
64
-
65
-
66
-
67
-
68
-
69
-
70
-
71
-
72
-
73
-
74
-
75
-
76
-
77
-
78
-
79
-
80
-
81
-
82
-
83
-
84
-
85
-
86
-
87
-
88
-
89
-
90
-
91
-
92
-
93
-
94
-
95
-
96
-
97
-
98
-
99
-
100
-
 101
101 -
 102
102 -
 103
103 -
 104
104 -
 105
105 -
 106
106 -
 107
107 -
 108
108 -
 109
109 -
 110
110 -
 111
111 -
 112
112 -
 113
113 -
 114
114 -
 115
115 -
 116
116 -
 117
117 -
 118
118 -
 119
119 -
 120
120 -
 121
121 -
122
-
123
-
124
-
125
-
126
-
127
-
128
-
129
-
130
-
131
-
132
-
133
 |
 |

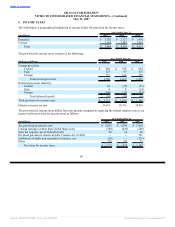
Table of Contents
ORACLE CORPORATION
NOTES TO CONSOLIDATED FINANCIAL STATEMENTS—(Continued)
May 31, 2007
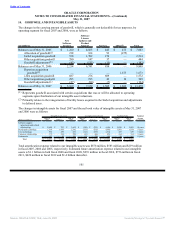
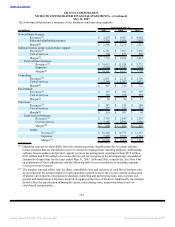
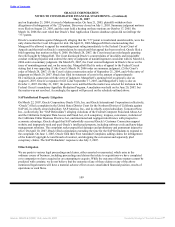
The following table reconciles operating segment revenues to total revenues as well as operating segment
margin to income before provision for income taxes:
Year Ended May 31,
(in millions) 2007 2006 2005
Total revenues for reportable segments $ 18,208 $ 14,771 $ 12,119
Software license updates and product support revenues(1) (212) (391) (320)
Total revenues $ 17,996 $ 14,380 $ 11,799
Total margin for reportable segments $ 10,909 $ 9,066 $ 7,535
Software license updates and product support revenues(1) (212) (391) (320)
Product development and information technology expenses (2,460) (2,160) (1,771)
Marketing and partner program expenses (424) (447) (378)
Corporate and general and administrative expenses (575) (473) (438)
Amortization of intangible assets (878) (583) (219)
Acquisition related (140) (137) (208)
Restructuring (19) (85) (147)
Stock-based compensation (198) (31) (25)
Interest expense (343) (169) (135)
Non-operating income, net 326 220 157
Income before provision for income taxes $ 5,986 $ 4,810 $ 4,051
(1) Software license updates and product support revenues for management reporting include revenues that
we did not recognize in the accompanying condensed consolidated statements of operations in the amount
of $212 million, $391 million and $320 million for fiscal 2007, fiscal 2006 and fiscal 2005, respectively.
See Note 6 for an explanation of these adjustments and this table for a reconciliation of operating segment
revenues to total revenues.
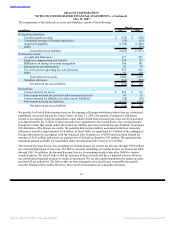
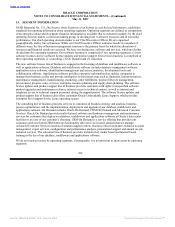
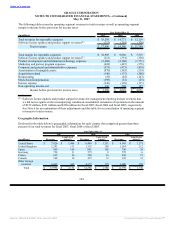
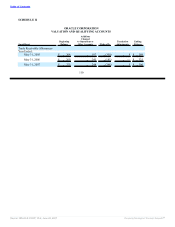
Geographic Information
Disclosed in the table below is geographic information for each country that comprised greater than three
percent of our total revenues for fiscal 2007, fiscal 2006 or fiscal 2005.
Year Ended May 31,
2007 2006 2005
Long Lived Long Lived Long Lived
(in millions) Revenues Assets(1) Revenues Assets(1) Revenues Assets(1)
United States $ 7,826 $ 1,404 $ 6,449 $ 1,351 $ 4,943 $ 1,371
United Kingdom 1,293 111 1,153 109 1,014 112
Japan 909 164 841 105 796 39
Germany 720 11 579 8 579 6
France 635 16 509 16 442 15
Canada 548 10 472 12 345 12
Other foreign
countries 6,065 415 4,377 179 3,680 185
Total $ 17,996 $ 2,131 $ 14,380 $ 1,780 $ 11,799 $ 1,740
104
Source: ORACLE CORP, 10-K, June 29, 2007 Powered by Morningstar® Document Research℠