Oracle 2006 Annual Report Download - page 47
Download and view the complete annual report
Please find page 47 of the 2006 Oracle annual report below. You can navigate through the pages in the report by either clicking on the pages listed below, or by using the keyword search tool below to find specific information within the annual report.-
 1
1 -
2
-
3
-
4
-
5
-
6
-
7
-
8
-
9
-
10
-
11
-
12
-
13
-
14
-
15
-
16
-
17
-
18
-
19
-
20
-
21
-
22
-
23
-
24
-
25
-
26
-
27
-
28
-
29
-
30
-
31
-
32
-
33
-
34
-
35
-
36
-
 37
37 -
 38
38 -
 39
39 -
 40
40 -
 41
41 -
 42
42 -
 43
43 -
 44
44 -
 45
45 -
 46
46 -
 47
47 -
 48
48 -
 49
49 -
 50
50 -
 51
51 -
 52
52 -
 53
53 -
 54
54 -
 55
55 -
 56
56 -
 57
57 -
58
-
59
-
60
-
61
-
62
-
63
-
64
-
65
-
66
-
67
-
68
-
69
-
70
-
71
-
72
-
73
-
74
-
75
-
76
-
77
-
78
-
79
-
80
-
81
-
82
-
83
-
84
-
85
-
86
-
87
-
88
-
89
-
90
-
91
-
92
-
93
-
94
-
95
-
96
-
97
-
98
-
99
-
100
-
101
-
102
-
103
-
104
-
105
-
106
-
107
-
108
-
109
-
110
-
111
-
112
-
113
-
114
-
115
-
116
-
117
-
118
-
119
-
120
-
121
-
122
-
123
-
124
-
125
-
126
-
127
-
128
-
129
-
130
-
131
-
132
-
133
 |
 |

Table of Contents
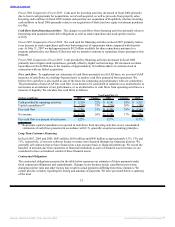
acquired at the beginning of fiscal 2007, and $16 million of incremental revenues from Hyperion. Excluding
the effect of currency rate fluctuations, the Americas contributed 55%, EMEA contributed 29% and Asia
Pacific contributed 16% to the increase in consulting revenues.
Excluding the effect of currency rate fluctuations, consulting expenses increased as a result of higher
personnel related expenses attributed to higher headcount levels and third-party contractor expenses.
Consulting expenses include $281 million of incremental expenses from i-flex and $17 million from
Hyperion. Total consulting margin as a percentage of revenues increased primarily due to higher margins
contributed by i-flex.
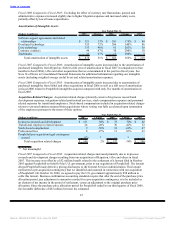
Fiscal 2006 Compared to Fiscal 2005: The increase in consulting revenues is primarily due to an increase in
application product implementations and billable hours primarily provided by consultants who were formerly
employed by our acquired companies. Excluding the effect of currency rate fluctuations, the Americas
contributed 56% to the growth in consulting revenues, EMEA contributed 26% and Asia Pacific contributed
18%.
Consulting expenses increased as a result of higher salary and benefit expenses due to additional resources we
acquired as part of our acquisitions and increased external contractor costs due to employee attrition. The total
consulting margin as a percentage of revenues declined in fiscal 2006 in comparison to fiscal 2005 as a result
of additional consulting expenses attributed to headcount levels and external contractor related expenditures.
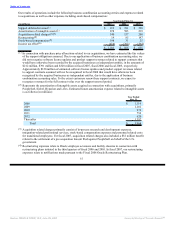
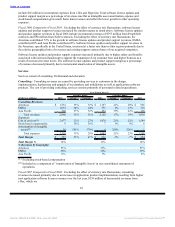
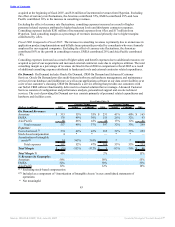
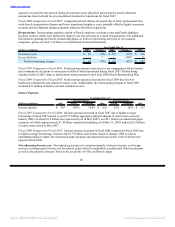
On Demand: On Demand includes Oracle On Demand, CRM On Demand and Advanced Customer
Services. Oracle On Demand provides multi-featured software and hardware management, and maintenance
services for our database and middleware as well as our applications software at our data center facilities or at
a site of our customer’s choosing. CRM On Demand is a service offering that provides our customers with
our Siebel CRM software functionality delivered via a hosted solution that we manage. Advanced Customer
Services consists of configuration and performance analysis, personalized support and on-site technical
services. The cost of providing On Demand services consists primarily of personnel related expenditures and
hardware and facilities costs.
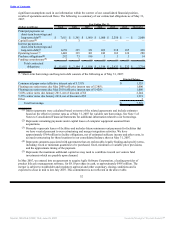
Year Ended May 31,
Percent Change Percent Change
(Dollars in millions) 2007 Actual Constant 2006 Actual Constant 2005
On Demand Revenues:
Americas $ 313 35% 35% $ 231 41% 40% $ 165
EMEA 176 49% 39% 118 26% 32% 93
Asia Pacific 68 46% 42% 48 13% 12% 41
Total revenues 557 40% 37% 397 32% 33% 299
Expenses:
Cost of services(1) 574 49% 45% 385 52% 53% 253
Stock-based compensation 4 * * — * * —
Amortization of intangible
assets(2) 14 365% 365% 3 * * —
Total expenses 592 52% 47% 388 53% 53% 253
Total Margin $ (35) -553% -512% $ 9 -83% -76% $ 46
Total Margin % -6% 2% 15%
% Revenues by Geography:
Americas 56% 58% 55%
EMEA 32% 30% 31%
Asia Pacific 12% 12% 14%
(1) Excluding stock-based compensation
(2) Included as a component of ‘Amortization of Intangible Assets’ in our consolidated statements of
operations
* Not meaningful
43
Source: ORACLE CORP, 10-K, June 29, 2007 Powered by Morningstar® Document Research℠