OfficeMax 2015 Annual Report Download - page 99
Download and view the complete annual report
Please find page 99 of the 2015 OfficeMax annual report below. You can navigate through the pages in the report by either clicking on the pages listed below, or by using the keyword search tool below to find specific information within the annual report.-
 1
1 -
2
-
3
-
4
-
5
-
6
-
7
-
8
-
9
-
10
-
11
-
12
-
13
-
14
-
15
-
16
-
17
-
18
-
19
-
20
-
21
-
22
-
23
-
24
-
25
-
26
-
27
-
28
-
29
-
30
-
31
-
32
-
33
-
34
-
35
-
36
-
37
-
38
-
39
-
40
-
41
-
42
-
43
-
44
-
45
-
46
-
47
-
48
-
49
-
50
-
51
-
52
-
53
-
54
-
55
-
56
-
57
-
58
-
59
-
60
-
61
-
62
-
63
-
64
-
65
-
66
-
67
-
68
-
69
-
70
-
71
-
72
-
73
-
74
-
75
-
76
-
77
-
78
-
79
-
80
-
81
-
82
-
83
-
84
-
85
-
86
-
87
-
88
-
 89
89 -
 90
90 -
 91
91 -
 92
92 -
 93
93 -
 94
94 -
 95
95 -
 96
96 -
 97
97 -
 98
98 -
 99
99 -
 100
100 -
 101
101 -
 102
102 -
 103
103 -
 104
104 -
 105
105 -
 106
106 -
 107
107 -
 108
108 -
 109
109 -
110
-
111
-
112
-
113
-
114
-
115
-
116
-
117
-
118
-
119
-
120
-
121
-
122
-
123
-
124
-
125
-
126
-
127
-
128
-
129
-
130
-
131
-
132
-
133
-
134
-
135
-
136
 |
 |

Table of Contents
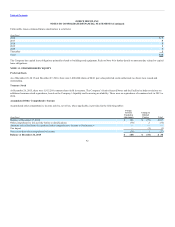
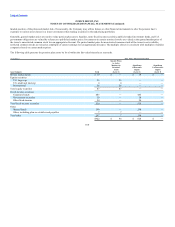
Obligations and Funded Status
The following table provides a reconciliation of changes in the projected benefit obligation and the fair value of plans assets, as well as the funded status of
the plans to amounts recognized on the Company’s Consolidated Balance Sheets. Pension plans with benefit obligations and accumulated benefit
obligations exceed plan assets in all individual plans.
(In millions) 2014 2014
Changes in projected benefit obligation:
Obligation at beginning of period $ 1,122 $ 17
Service cost 3 —
Interest cost 52 1
Actuarial (gain) loss 138 1
Currency exchange rate change — (1)
Benefits paid (97) (1)
Obligation at end of period $ 1,218 $ 17
Change in plan assets:
Fair value of plan assets at beginning of period $ 986 $ —
Actual return (loss) on plan assets 107 —
Employer contribution 43 1
Benefits paid (97) (1)
Fair value of plan assets at end of period 1,039 —
Net liability recognized at end of period $ (179) $ (17)
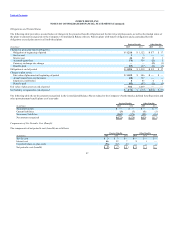
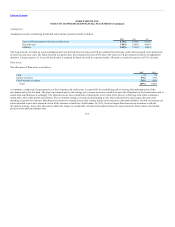
The following table shows the amounts recognized in the Consolidated Balance Sheets related to the Company’s North America defined benefit pension and
other postretirement benefit plans as of year-ends:
(In millions) 2014 2014
Noncurrent assets $ — $ —
Current liabilities (3) (1)
Noncurrent liabilities (176) (16)
Net amount recognized $(179) $(17)
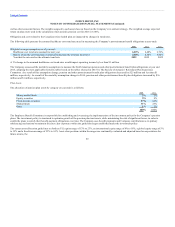
Components of Net Periodic Cost (Benefit)
The components of net periodic cost (benefit) are as follows:
(In millions) 2014 2013 2014 2013
Service cost $ 3 $— $— $—
Interest cost 52 7 1 —
Expected return on plan assets (62) (8) — —
Net periodic cost (benefit) $ (7) $ (1) $ 1 $—
97