OfficeMax 2015 Annual Report Download - page 110
Download and view the complete annual report
Please find page 110 of the 2015 OfficeMax annual report below. You can navigate through the pages in the report by either clicking on the pages listed below, or by using the keyword search tool below to find specific information within the annual report.-
 1
1 -
2
-
3
-
4
-
5
-
6
-
7
-
8
-
9
-
10
-
11
-
12
-
13
-
14
-
15
-
16
-
17
-
18
-
19
-
20
-
21
-
22
-
23
-
24
-
25
-
26
-
27
-
28
-
29
-
30
-
31
-
32
-
33
-
34
-
35
-
36
-
37
-
38
-
39
-
40
-
41
-
42
-
43
-
44
-
45
-
46
-
47
-
48
-
49
-
50
-
51
-
52
-
53
-
54
-
55
-
56
-
57
-
58
-
59
-
60
-
61
-
62
-
63
-
64
-
65
-
66
-
67
-
68
-
69
-
70
-
71
-
72
-
73
-
74
-
75
-
76
-
77
-
78
-
79
-
80
-
81
-
82
-
83
-
84
-
85
-
86
-
87
-
88
-
89
-
90
-
91
-
92
-
93
-
94
-
95
-
96
-
97
-
98
-
99
-
 100
100 -
 101
101 -
 102
102 -
 103
103 -
 104
104 -
 105
105 -
 106
106 -
 107
107 -
 108
108 -
 109
109 -
 110
110 -
 111
111 -
 112
112 -
 113
113 -
 114
114 -
 115
115 -
 116
116 -
 117
117 -
 118
118 -
 119
119 -
 120
120 -
121
-
122
-
123
-
124
-
125
-
126
-
127
-
128
-
129
-
130
-
131
-
132
-
133
-
134
-
135
-
136
 |
 |

Table of Contents
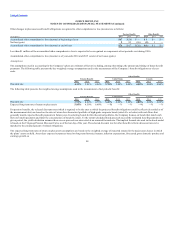
• Recourse debt for which there were no transactions on the measurement date was valued based on quoted market prices near the
measurement date when available or by discounting the future cash flows of each instrument using rates based on the most recently observable
trade or using rates currently offered to the Company for similar debt instruments of comparable maturities (Level 2 measure).
• Fair value is estimated by discounting the future cash flows of the instrument at rates currently available to the Company for
similar instruments of comparable maturities (Level 2 measure).
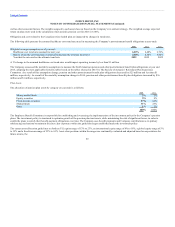
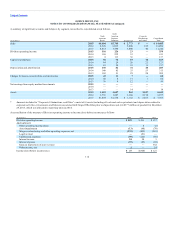
All impairment charges discussed in the sections below are presented in Asset impairments in the Consolidated Statements of Operations.
Because of declining sales in recent periods and adoption of the Real Estate Strategy in 2014, the Company has conducted a detailed quarterly store
impairment analysis. The analysis uses input from retail store operations and the Company’s accounting and finance personnel that organizationally report to
the Chief Financial Officer. These Level 3 projections are based on management’s estimates of store-level sales, gross margins, direct expenses, exercise of
future lease renewal options where applicable, and resulting cash flows and, by their nature, include judgments about how current initiatives will impact
future performance. If the anticipated cash flows of a store cannot support the carrying value of its assets, the assets are impaired and written down to
estimated fair value using Level 3 measure. The Company recognized store asset impairment charges of $12 million, $25 million, and $26 million in 2015,
2014, and 2013, respectively.
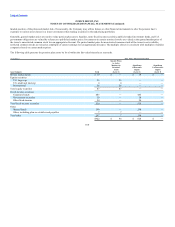
The projections prepared for the 2015 analysis assumed declining sales over the forecast period, consistent with recent experience. Gross margin and
operating cost assumptions have been held at levels consistent with recent actual results and planned activities. Estimated cash flows were discounted at 12%
in 2015 and 13% for the two preceding years. The impairment charges include amounts to bring the location’s assets to estimated fair value based on
projected operating cash flows or residual value, as appropriate. Assets added to previously impaired locations, whether for Division-wide enhancements or
specific location betterments, are capitalized and subsequently tested for impairment. For the fourth quarter 2015 calculation, a 100 basis point decrease in
next year sales combined with a 50 basis point decrease in next year gross margin would have increased the impairment by less than $1 million. Further, a
100 basis point decrease in sales for all future periods would increase the impairment by $2 million and a 2% increase in payroll costs above the historical
growth rate would increase the impairment $2 million.
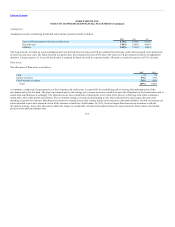
The Company will continue to evaluate initiatives to improve performance and lower operating costs. To the extent that forward-looking sales and operating
assumptions are not achieved and are subsequently reduced, additional impairment charges may result. However, at the end of 2015, the impairment analysis
reflects the Company’s best estimate of future performance.
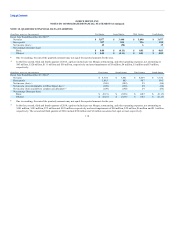
Software and Definite-lived intangible assets — Asset impairment charges for 2014 include $12 million resulting from a decision to convert certain websites
to a common platform, $28 million related to the abandonment of a software implementation project in Europe, and $13 million write off of capitalized
software following certain information technology platform decisions related to the Merger.
108