OfficeMax 2015 Annual Report Download - page 30
Download and view the complete annual report
Please find page 30 of the 2015 OfficeMax annual report below. You can navigate through the pages in the report by either clicking on the pages listed below, or by using the keyword search tool below to find specific information within the annual report.-
 1
1 -
2
-
3
-
4
-
5
-
6
-
7
-
8
-
9
-
10
-
11
-
12
-
13
-
14
-
15
-
16
-
17
-
18
-
19
-
 20
20 -
 21
21 -
 22
22 -
 23
23 -
 24
24 -
 25
25 -
 26
26 -
 27
27 -
 28
28 -
 29
29 -
 30
30 -
 31
31 -
 32
32 -
 33
33 -
 34
34 -
 35
35 -
 36
36 -
 37
37 -
 38
38 -
 39
39 -
 40
40 -
41
-
42
-
43
-
44
-
45
-
46
-
47
-
48
-
49
-
50
-
51
-
52
-
53
-
54
-
55
-
56
-
57
-
58
-
59
-
60
-
61
-
62
-
63
-
64
-
65
-
66
-
67
-
68
-
69
-
70
-
71
-
72
-
73
-
74
-
75
-
76
-
77
-
78
-
79
-
80
-
81
-
82
-
83
-
84
-
85
-
86
-
87
-
88
-
89
-
90
-
91
-
92
-
93
-
94
-
95
-
96
-
97
-
98
-
99
-
100
-
101
-
102
-
103
-
104
-
105
-
106
-
107
-
108
-
109
-
110
-
111
-
112
-
113
-
114
-
115
-
116
-
117
-
118
-
119
-
120
-
121
-
122
-
123
-
124
-
125
-
126
-
127
-
128
-
129
-
130
-
131
-
132
-
133
-
134
-
135
-
136
 |
 |

Table of Contents
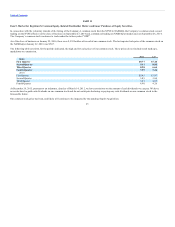
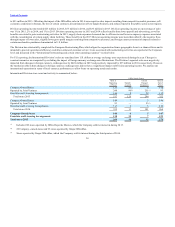
Fiscal year 2014 Net income (loss), Net income attributable to Office Depot, Inc., and Net income available to common shareholders include $88
million of asset impairment charges, $403 million of Merger-related, restructuring, and other operating expenses, and $81 million of Legal accrual.
Refer to MD&A for additional information.
Fiscal year 2012 Net income (loss), Net income attributable to Office Depot, Inc., and Net income available to common shareholders include $139
million of asset impairment charges, $63 million net gain on purchase price recovery and $51 million of charges related to closure costs and process
improvement activity.
Fiscal year 2011 Net income (loss), Net income attributable to Office Depot, Inc., and Net income available to common shareholders include $58
million of charges relating to facility closure and process improvement activity. Additionally, $123 million of tax and interest benefits were
recognized associated with settlements and removal of contingencies and valuation allowances.
Includes International Division distribution centers and Canadian distribution centers and crossdock facilities. Fiscal year 2013 includes 144 stores
operated by our International Division and 19 stores in Canada operated by our North American Business Solutions Division. These Canadian stores
were closed in 2014.
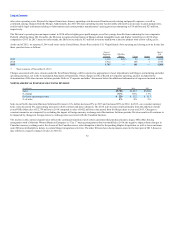
Amounts for fiscal years 2014, 2013, 2012, and 2011 have changed from prior years’ disclosures to reflect the balance sheet classification of all
deferred tax assets and liabilities as noncurrent and debt issuance costs as a reduction of the related liability rather than as an asset, in connection with
the adoption of new accounting guidance in 2015. Total assets decreased by $87 million, $112 million, $45 million, and $39 million in 2014, 2013,
2012, and 2011, respectively. Refer to Basis of Presentation in Note 1, “Summary of Significant Accounting Policies” in the Notes to the Consolidated
Financial Statements for additional information.
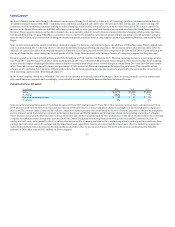
Amounts for fiscal years 2014, 2013, 2012, and 2011 have changed from prior years’ disclosures to reflect the balance sheet classification of debt
issuance costs as a reduction of the related liability rather than as an asset, in connection with the adoption of new accounting guidance in 2015. Long-
term recourse debt, net of current maturities decreased by $4 million, $5 million, $6 million, and $1 million in 2014, 2013, 2012, and 2011,
respectively. Refer to Basis of Presentation in Note 1, “Summary of Significant Accounting Policies” in the Notes to the Consolidated Financial
Statements for additional information.
28
(4)
(5)
(6)
(7)
(8)
(9)