OfficeMax 2015 Annual Report Download - page 101
Download and view the complete annual report
Please find page 101 of the 2015 OfficeMax annual report below. You can navigate through the pages in the report by either clicking on the pages listed below, or by using the keyword search tool below to find specific information within the annual report.-
 1
1 -
2
-
3
-
4
-
5
-
6
-
7
-
8
-
9
-
10
-
11
-
12
-
13
-
14
-
15
-
16
-
17
-
18
-
19
-
20
-
21
-
22
-
23
-
24
-
25
-
26
-
27
-
28
-
29
-
30
-
31
-
32
-
33
-
34
-
35
-
36
-
37
-
38
-
39
-
40
-
41
-
42
-
43
-
44
-
45
-
46
-
47
-
48
-
49
-
50
-
51
-
52
-
53
-
54
-
55
-
56
-
57
-
58
-
59
-
60
-
61
-
62
-
63
-
64
-
65
-
66
-
67
-
68
-
69
-
70
-
71
-
72
-
73
-
74
-
75
-
76
-
77
-
78
-
79
-
80
-
81
-
82
-
83
-
84
-
85
-
86
-
87
-
88
-
89
-
90
-
 91
91 -
 92
92 -
 93
93 -
 94
94 -
 95
95 -
 96
96 -
 97
97 -
 98
98 -
 99
99 -
 100
100 -
 101
101 -
 102
102 -
 103
103 -
 104
104 -
 105
105 -
 106
106 -
 107
107 -
 108
108 -
 109
109 -
 110
110 -
 111
111 -
112
-
113
-
114
-
115
-
116
-
117
-
118
-
119
-
120
-
121
-
122
-
123
-
124
-
125
-
126
-
127
-
128
-
129
-
130
-
131
-
132
-
133
-
134
-
135
-
136
 |
 |

Table of Contents
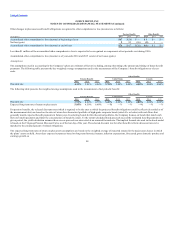
well as other economic factors. The weights assigned to each asset class are based on the Company’s investment strategy. The weighted average expected
return on plan assets used in the calculation of net periodic pension cost for 2016 is 6.00%.
Obligation and costs related to the Canadian retiree health plan are impacted by changes in trend rates.
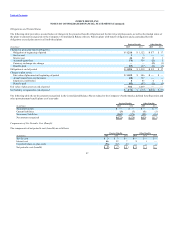
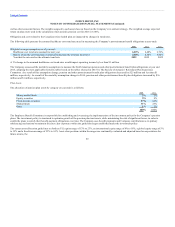
The following table presents the assumed healthcare cost trend rates used in measuring the Company’s postretirement benefit obligations at year-ends:
2014 2013
Weighted average assumptions as of year-end:
Healthcare cost trend rate assumed for next year 6.40% 6.70%
Rate to which the cost trend rate is assumed to decline (the ultimate trend rate) 4.50% 4.50%
Year that the rate reaches the ultimate trend rate 2022 2022
A 1% change in the assumed healthcare cost trend rates would impact operating income by less than $1 million.
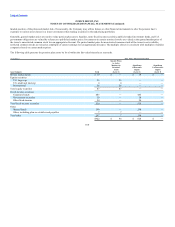
The Company reassessed the mortality assumptions to measure the North American pension and other postretirement benefit plan obligations at year end
2015, adopting the most applicable mortality tables based on the tables released in 2015 by The Society of Actuaries’ Retirement Plan Experience
Committee. As a result of this assumption change, pension and other postretirement benefit plan obligations decreased by $25 million and less than $1
million, respectively. As a result of the mortality assumption change in 2014, pension and other postretirement benefit plan obligations increased by $36
million and $1 million, respectively.
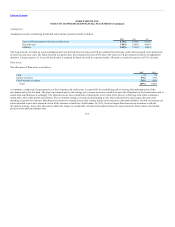
Plan Assets
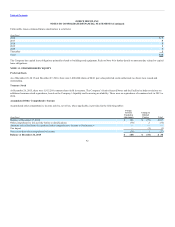
The allocation of pension plan assets by category at year-ends is as follows:
2014
Money market funds 2%
Equity securities 8%
Fixed-income securities 64%
Mutual funds 25%
Other 1%
100%
The Employee Benefit Committee is responsible for establishing and overseeing the implementation of the investment policy for the Company’s pension
plans. The investment policy is structured to optimize growth of the pension plan trust assets, while minimizing the risk of significant losses, in order to
enable the plans to satisfy their benefit payment obligations over time. The Company uses benefit payments and Company contributions as its primary
rebalancing mechanisms to maintain the asset class exposures within the guideline ranges established under the investment policy.
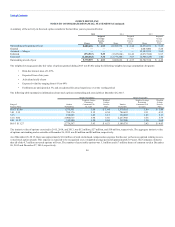
The current asset allocation guidelines set forth an U.S. equity range of 13% to 23%, an international equity range of 8% to 18%, a global equity range of 5%
to 15% and a fixed-income range of 53% to 63%. Asset-class positions within the ranges are continually evaluated and adjusted based on expectations for
future returns, the
99