OfficeMax 2015 Annual Report Download - page 97
Download and view the complete annual report
Please find page 97 of the 2015 OfficeMax annual report below. You can navigate through the pages in the report by either clicking on the pages listed below, or by using the keyword search tool below to find specific information within the annual report.-
 1
1 -
2
-
3
-
4
-
5
-
6
-
7
-
8
-
9
-
10
-
11
-
12
-
13
-
14
-
15
-
16
-
17
-
18
-
19
-
20
-
21
-
22
-
23
-
24
-
25
-
26
-
27
-
28
-
29
-
30
-
31
-
32
-
33
-
34
-
35
-
36
-
37
-
38
-
39
-
40
-
41
-
42
-
43
-
44
-
45
-
46
-
47
-
48
-
49
-
50
-
51
-
52
-
53
-
54
-
55
-
56
-
57
-
58
-
59
-
60
-
61
-
62
-
63
-
64
-
65
-
66
-
67
-
68
-
69
-
70
-
71
-
72
-
73
-
74
-
75
-
76
-
77
-
78
-
79
-
80
-
81
-
82
-
83
-
84
-
85
-
86
-
 87
87 -
 88
88 -
 89
89 -
 90
90 -
 91
91 -
 92
92 -
 93
93 -
 94
94 -
 95
95 -
 96
96 -
 97
97 -
 98
98 -
 99
99 -
 100
100 -
 101
101 -
 102
102 -
 103
103 -
 104
104 -
 105
105 -
 106
106 -
 107
107 -
108
-
109
-
110
-
111
-
112
-
113
-
114
-
115
-
116
-
117
-
118
-
119
-
120
-
121
-
122
-
123
-
124
-
125
-
126
-
127
-
128
-
129
-
130
-
131
-
132
-
133
-
134
-
135
-
136
 |
 |
Table of Contents
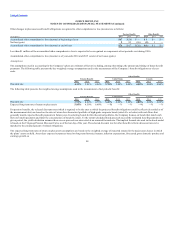
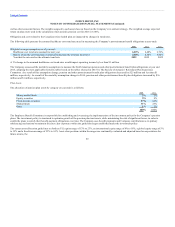
In 2015, the Company granted 2.9 million shares of restricted stock and restricted stock units to eligible employees. In addition, 0.1 million shares were
granted to the Board of Directors as part of their annual compensation and vested immediately on the grant date with distribution to occur following their
separation from service with the Company. Restricted stock grants to Company employees typically vest annually over a three-year service period. A
summary of the status of the Company’s nonvested shares and changes during 2015, 2014, and 2013 is presented below.
2015 2014 2013
Shares
Weighted
Average
Grant-
Date
Price Shares
Weighted
Average
Grant-
Date
Price Shares
Weighted
Average
Grant-
Date
Price
Outstanding at beginning of year 10,207,546 $ 4.76 5,459,900 $ 3.52
Granted 5,809,821 4.33 4,884,848 4.54
Assumed — Merger — — 6,426,968 3.46
Vested (4,179,789) 4.75 (5,788,992) 4.49
Forfeited (1,129,206) 3.65 (775,178) 4.01
Outstanding at end of year 10,708,372 $ 4.65 10,207,546 $ 4.76
As of December 26, 2015, there was $29 million of total unrecognized compensation cost related to nonvested restricted stock. This expense, net of
forfeitures, is expected to be recognized over a weighted-average period of approximately 1.8 years. Total outstanding shares of 9.6 million include 1.7
million granted to members of the Board of Directors that have vested but will not be issued until separation from service and 7.9 million unvested shares
granted to employees. Of the 7.9 million unvested shares at year end, the Company estimates that 7.6 million shares will vest. The total fair value of shares at
the time they vested during 2015 was $31 million.
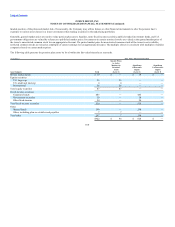
The Company has a performance-based long-term incentive program consisting of performance stock units. Payouts under this program are based on
achievement of certain financial targets set by the Board of Directors and are subject to additional service vesting requirements, generally of three years from
the grant date.
A summary of the activity in the performance-based long-term incentive program since inception is presented below.
2014 2013
Shares
Weighted
Average
Grant-Date
Price Shares
Weighted
Average
Grant-Date
Price
Outstanding at beginning of the year 3,076,292 $ 4.45 1,030,753 $ 3.25
Granted 5,289,047 4.55 4,317,314 4.55
Vested (1,246,006) 3.74 (261,095) 3.63
Forfeited (310,369) 4.16 (2,010,680) 4.15
Outstanding at end of the year 6,808,964 $ 4.43 3,076,292 $ 4.45
95