OfficeMax 2015 Annual Report Download - page 114
Download and view the complete annual report
Please find page 114 of the 2015 OfficeMax annual report below. You can navigate through the pages in the report by either clicking on the pages listed below, or by using the keyword search tool below to find specific information within the annual report.-
 1
1 -
2
-
3
-
4
-
5
-
6
-
7
-
8
-
9
-
10
-
11
-
12
-
13
-
14
-
15
-
16
-
17
-
18
-
19
-
20
-
21
-
22
-
23
-
24
-
25
-
26
-
27
-
28
-
29
-
30
-
31
-
32
-
33
-
34
-
35
-
36
-
37
-
38
-
39
-
40
-
41
-
42
-
43
-
44
-
45
-
46
-
47
-
48
-
49
-
50
-
51
-
52
-
53
-
54
-
55
-
56
-
57
-
58
-
59
-
60
-
61
-
62
-
63
-
64
-
65
-
66
-
67
-
68
-
69
-
70
-
71
-
72
-
73
-
74
-
75
-
76
-
77
-
78
-
79
-
80
-
81
-
82
-
83
-
84
-
85
-
86
-
87
-
88
-
89
-
90
-
91
-
92
-
93
-
94
-
95
-
96
-
97
-
98
-
99
-
100
-
101
-
102
-
103
-
 104
104 -
 105
105 -
 106
106 -
 107
107 -
 108
108 -
 109
109 -
 110
110 -
 111
111 -
 112
112 -
 113
113 -
 114
114 -
 115
115 -
 116
116 -
 117
117 -
 118
118 -
 119
119 -
 120
120 -
 121
121 -
 122
122 -
 123
123 -
 124
124 -
125
-
126
-
127
-
128
-
129
-
130
-
131
-
132
-
133
-
134
-
135
-
136
 |
 |
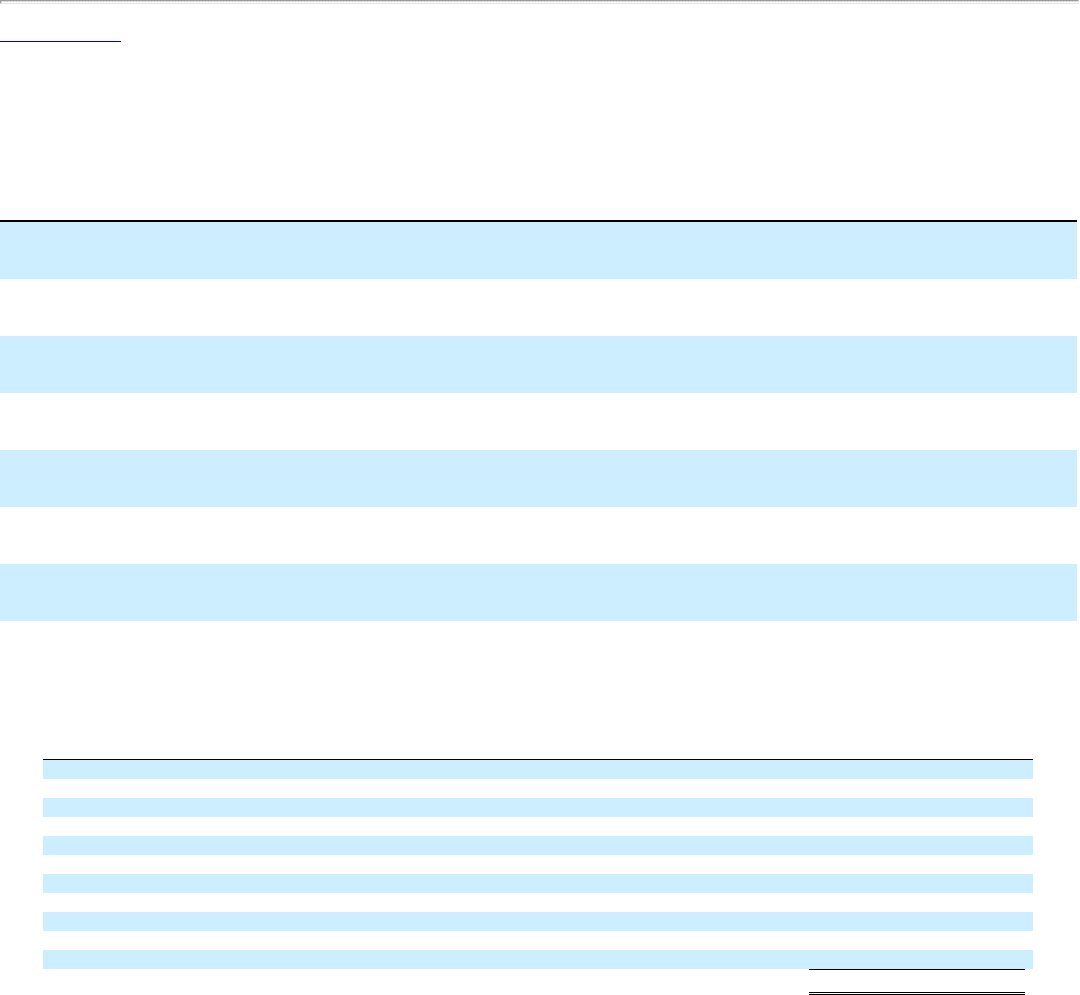
Table of Contents
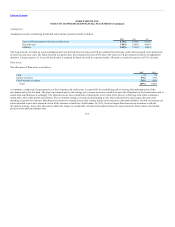
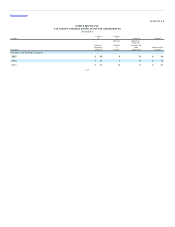
A summary of significant accounts and balances by segment, reconciled to consolidated totals follows.
(In millions)
North
American
Retail
North
American
Business
Solutions International
Corporate,
Eliminations,
and Other*
Consolidated
Total
Sales
2014 6,528 6,013 3,400 155 16,096
2013 4,614 3,580 3,008 40 11,242
Division operating income
2014 126 232 53 — 411
2013 8 113 36 — 157
Capital expenditures
2014 44 29 29 21 123
2013 63 24 39 11 137
Depreciation and amortization
2014 140 85 35 53 313
2013 105 51 29 24 209
Charges for losses on receivables and inventories
2014 48 4 13 1 66
2013 38 9 12 — 59
Net earnings from equity method investments
2014 — — — — —
2013 — — 14 — 14
Assets
2014 1,736 1,687 1,160 2,174 6,757
2013 $1,804 $1,554 $ 1,152 $ 2,855 $ 7,365
* Amounts included in “Corporate, Eliminations, and Other” consist of (i) assets (including all cash and cash equivalents) and depreciation related to
corporate activities, (ii) accounts and balances associated with Grupo OfficeMax prior to disposition, and (iii) $377 million of goodwill in December
28, 2013, which was allocated to reporting units in 2014.
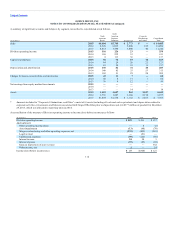
A reconciliation of the measure of Division operating income to Income (loss) before income taxes follows:
(In millions) 2014 2013
Division operating income $ 411 $ 157
Add/(subtract):
Other operating income (loss) 8 (2)
Asset impairments (88) (70)
Merger, restructuring, and other operating expenses, net (403) (201)
Legal accrual (81) —
Unallocated expenses (122) (89)
Interest income 24 5
Interest expense (89) (69)
Gain on disposition of joint venture — 382
Other income, net — 14
Income (loss) before income taxes $(340) $ 127
112