OfficeMax 2015 Annual Report Download - page 36
Download and view the complete annual report
Please find page 36 of the 2015 OfficeMax annual report below. You can navigate through the pages in the report by either clicking on the pages listed below, or by using the keyword search tool below to find specific information within the annual report.-
 1
1 -
2
-
3
-
4
-
5
-
6
-
7
-
8
-
9
-
10
-
11
-
12
-
13
-
14
-
15
-
16
-
17
-
18
-
19
-
20
-
21
-
22
-
23
-
24
-
25
-
 26
26 -
 27
27 -
 28
28 -
 29
29 -
 30
30 -
 31
31 -
 32
32 -
 33
33 -
 34
34 -
 35
35 -
 36
36 -
 37
37 -
 38
38 -
 39
39 -
 40
40 -
 41
41 -
 42
42 -
 43
43 -
 44
44 -
 45
45 -
 46
46 -
47
-
48
-
49
-
50
-
51
-
52
-
53
-
54
-
55
-
56
-
57
-
58
-
59
-
60
-
61
-
62
-
63
-
64
-
65
-
66
-
67
-
68
-
69
-
70
-
71
-
72
-
73
-
74
-
75
-
76
-
77
-
78
-
79
-
80
-
81
-
82
-
83
-
84
-
85
-
86
-
87
-
88
-
89
-
90
-
91
-
92
-
93
-
94
-
95
-
96
-
97
-
98
-
99
-
100
-
101
-
102
-
103
-
104
-
105
-
106
-
107
-
108
-
109
-
110
-
111
-
112
-
113
-
114
-
115
-
116
-
117
-
118
-
119
-
120
-
121
-
122
-
123
-
124
-
125
-
126
-
127
-
128
-
129
-
130
-
131
-
132
-
133
-
134
-
135
-
136
 |
 |

Table of Contents
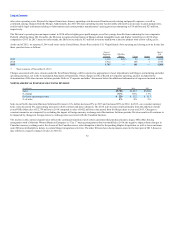
to $93 million in 2013. Offsetting the impact of the OfficeMax sales in 2014 were negative sales impacts resulting from competitive market pressures, soft
economic conditions in Europe, the loss of certain contracts, discontinuation of low margin business, and reduced spend in the public sector across regions.
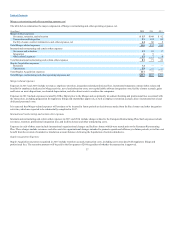
Division operating income totaled $23 million in 2015, $53 million in 2014, and $36 million in 2013. Division operating income as a percentage of sales
was 1% in 2015, 2% in 2014, and 1% in 2013. Division operating income in 2015 and 2014 reflect benefits from lower payroll and advertising, as well as
benefits associated to prior restructuring activities. In 2015, supply chain expenses decreased due to efficiencies and lower occupancy expenses associated
with the consolidation of certain supply chain facilities. These benefits in the 2015 Division operating income were more than offset by the negative flow-
through impact of lower sales, slightly lower gross profit margins resulting from competitive pressures, and foreign currency transaction impacts related to
certain merchandise purchases denominated in U.S. dollars.
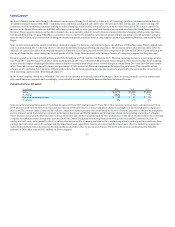
The Division has substantially completed the European Restructuring Plan, which aligns the organization from a geographic-focus to a channel-focus and is
intended to provide operational efficiency and allow enhanced customer service. Costs associated with restructuring activities are reported at the Corporate
level and discussed in the “International restructuring and certain other operating expenses” section below.
For U.S. reporting, the International Division’s sales are translated into U.S. dollars at average exchange rates experienced during the year. Changes in
constant currencies are computed by excluding the impact of foreign currency exchange rates fluctuations. The Division’s reported sales were negatively
impacted from changes in foreign currency exchange rates by $424 million in 2015 and positively impacted by $35 million in 2014, respectively. However,
the translation effects from changes in foreign currency exchange rates did not have a significant impact on Division operating income. We analyze our
international operations in terms of local currency performance to allow focus on operating trends and results.
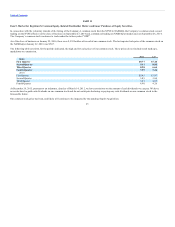
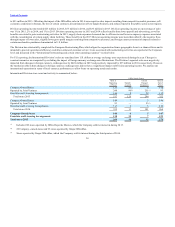
International Division store count and activity is summarized below:
Office Supply Stores
Open at
Beginning
of Period
Opened/
Acquired
Closed/
Changed
Designation
Open at
End of
Period
Company-Owned Stores 123 25 4 144
Operated by Joint Ventures 248 96 251 93
Franchise and Licensing Arrangements 146 8 39 115
Total stores 2013 517 129 294 352
Company-Owned Stores 144 7 5 146
Operated by Joint Ventures 93 — 93 —
Franchise and Licensing Arrangements 115 6 3 118
Total stores 2014 352 13 101 264
Includes 249 stores operated by Office Depot de Mexico, which the Company sold its interest in during 2013.
22 Company–owned stores and 93 stores operated by Grupo OfficeMax.
Stores operated by Grupo OfficeMax, which the Company sold its interest during the third quarter of 2014.
34
(2)
(2) (1)
(3)
(1)
(2)
(3)