OfficeMax 2015 Annual Report Download - page 33
Download and view the complete annual report
Please find page 33 of the 2015 OfficeMax annual report below. You can navigate through the pages in the report by either clicking on the pages listed below, or by using the keyword search tool below to find specific information within the annual report.-
 1
1 -
2
-
3
-
4
-
5
-
6
-
7
-
8
-
9
-
10
-
11
-
12
-
13
-
14
-
15
-
16
-
17
-
18
-
19
-
20
-
21
-
22
-
 23
23 -
 24
24 -
 25
25 -
 26
26 -
 27
27 -
 28
28 -
 29
29 -
 30
30 -
 31
31 -
 32
32 -
 33
33 -
 34
34 -
 35
35 -
 36
36 -
 37
37 -
 38
38 -
 39
39 -
 40
40 -
 41
41 -
 42
42 -
 43
43 -
44
-
45
-
46
-
47
-
48
-
49
-
50
-
51
-
52
-
53
-
54
-
55
-
56
-
57
-
58
-
59
-
60
-
61
-
62
-
63
-
64
-
65
-
66
-
67
-
68
-
69
-
70
-
71
-
72
-
73
-
74
-
75
-
76
-
77
-
78
-
79
-
80
-
81
-
82
-
83
-
84
-
85
-
86
-
87
-
88
-
89
-
90
-
91
-
92
-
93
-
94
-
95
-
96
-
97
-
98
-
99
-
100
-
101
-
102
-
103
-
104
-
105
-
106
-
107
-
108
-
109
-
110
-
111
-
112
-
113
-
114
-
115
-
116
-
117
-
118
-
119
-
120
-
121
-
122
-
123
-
124
-
125
-
126
-
127
-
128
-
129
-
130
-
131
-
132
-
133
-
134
-
135
-
136
 |
 |

Table of Contents
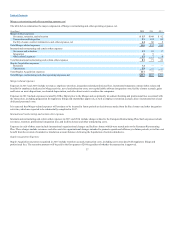
• At the end of 2015, we had $1.1 billion in cash and cash equivalents and $1.2 billion available on our asset based credit facility. Cash flow from operating
activities was a source of $126 million for 2015.
Discussion of additional income and expense items, including material charges and credits and changes in interest and income taxes follows our review of
segment results.
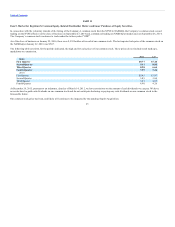
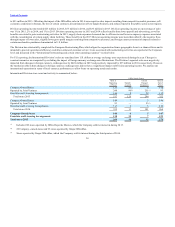
(In millions) 2014 2013
Sales $6,528 $4,614
% change 41% 3%
Division operating income $ 126 $ 8
% of sales 2% —%
Comparable store sales increase (decline) (2)% (4)%
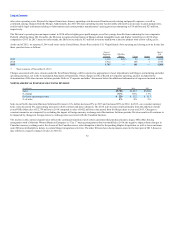
Sales in our North American Retail Division decreased 8% in 2015 and increased 41% in 2014. Sales in each of the three years were negatively impacted by
store closures. Store closure activity is shown below. The 2014 sales increase resulted from the addition of a full year of OfficeMax sales of $2,526 million
compared to sales of $384 million in the period from the Merger date to year-end 2013.
Our comparable store sales relate to stores that have been open for at least one year. Stores are removed from the comparable sales calculation one month prior
to closing, as sales during that period are largely non-comparable clearance activity, and during periods of store remodeling and if significantly downsized.
Our measure of comparable store sales has been applied consistently across periods, but may differ from measures used by other companies.
Comparable store sales in 2015 from the 1,552 stores that were open for more than one year were flat. Comparable store sales in 2014 decreased 2%. As the
Company continues to implement the Real Estate Strategy, current period comparable store sales calculations are positively affected from customers
transferring from closed to nearby stores which remain open, though the impact declines after the one year anniversary of the store closure. The average sales
transfer rate achieved to date under the Real Estate Strategy is estimated to be at least 30% and we anticipate a continued favorable impact from sales transfer
as we implement the remaining portion of the Real Estate Strategy.
The 2015 improvement in comparable store sales reflects increases in supplies, furniture, copy and print services, ink and toner and declines in computer and
related technology products. In 2015, transaction counts increased and average order value decreased compared to prior year. The increase in transaction
counts result from increased traffic in stores due to sales transfer resulting from store closures and improvements in customer in-store experience.
Additionally, 2015 sales include an increase in online sales picked up by customers in stores. We expect that trend to continue in 2016. The average order
values in 2015 reflect, primarily, the decline in technology sales as customers continue to reduce purchases in this overall category, partially offset by the
increase in average sale prices on furniture products.
In 2014, transaction counts and average order values decreased when compared to the prior year, consistent with the comparable store sales declines. Lower
transaction counts reflect lower customer traffic. The decline in average order values reflect, in part, declines in technology sales, as well as lower average sale
prices on certain computer products. Additionally, sales of ink, toner, and paper declined reflecting the highly-competitive market for sales of these products.
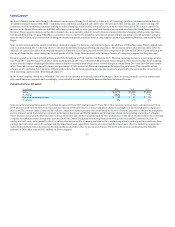
The North American Retail Division reported operating income of $310 million in 2015, compared to $126 million in 2014 and $8 million in 2013. Store
closures contributed to declines in 2015 of occupancy, payroll and
31