OfficeMax 2015 Annual Report Download - page 34
Download and view the complete annual report
Please find page 34 of the 2015 OfficeMax annual report below. You can navigate through the pages in the report by either clicking on the pages listed below, or by using the keyword search tool below to find specific information within the annual report.-
 1
1 -
2
-
3
-
4
-
5
-
6
-
7
-
8
-
9
-
10
-
11
-
12
-
13
-
14
-
15
-
16
-
17
-
18
-
19
-
20
-
21
-
22
-
23
-
 24
24 -
 25
25 -
 26
26 -
 27
27 -
 28
28 -
 29
29 -
 30
30 -
 31
31 -
 32
32 -
 33
33 -
 34
34 -
 35
35 -
 36
36 -
 37
37 -
 38
38 -
 39
39 -
 40
40 -
 41
41 -
 42
42 -
 43
43 -
 44
44 -
45
-
46
-
47
-
48
-
49
-
50
-
51
-
52
-
53
-
54
-
55
-
56
-
57
-
58
-
59
-
60
-
61
-
62
-
63
-
64
-
65
-
66
-
67
-
68
-
69
-
70
-
71
-
72
-
73
-
74
-
75
-
76
-
77
-
78
-
79
-
80
-
81
-
82
-
83
-
84
-
85
-
86
-
87
-
88
-
89
-
90
-
91
-
92
-
93
-
94
-
95
-
96
-
97
-
98
-
99
-
100
-
101
-
102
-
103
-
104
-
105
-
106
-
107
-
108
-
109
-
110
-
111
-
112
-
113
-
114
-
115
-
116
-
117
-
118
-
119
-
120
-
121
-
122
-
123
-
124
-
125
-
126
-
127
-
128
-
129
-
130
-
131
-
132
-
133
-
134
-
135
-
136
 |
 |

Table of Contents
other store operating costs. Beyond the impact from store closures, operating costs decreased from lower advertising and payroll expenses, as well as
continued synergy impacts from the Merger. Additionally, the 2015 Division operating income was favorably affected by an increase in gross margin rates,
and favorable legal settlements relating to labor matters and certain product manufacturers’ pricing practices amounting to $16 million and $23 million,
respectively.
The Division’s operating income improvement in 2014 reflects higher gross profit margin, as well as synergy benefits from combining the two companies.
Partially offsetting these 2014 benefits, the Division recognized amortization of Merger-related intangible assets and higher variable pay in 2014 when
compared to 2013. In 2013, based on sales trends, the Division recorded a $13 million inventory markdown related to product with a short selling cycle.
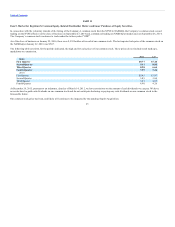
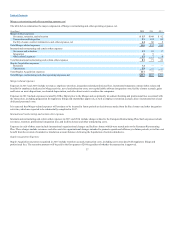
At the end of 2015, we operated 1,564 retail stores in the United States, Puerto Rico and the U.S. Virgin Islands. Store opening and closing activity for the last
three years has been as follows:
Open at
Beginning
of Period
OfficeMax
Merger Closed Opened
Open at
End
of Period
2013 1,112 829 33 4 1,912
2014 1,912 — 168 1 1,745
Store count as of November 5, 2013.
Charges associated with store closures under the Real Estate Strategy will be reported as appropriate in Asset impairments and Merger, restructuring and other
operating expenses, net in the Consolidated Statements of Operations. These charges will be reflected in Corporate reporting, and not included in the
determination of Division income in future periods. Refer to “Corporate and other” discussion below for additional information of expenses incurred to date.
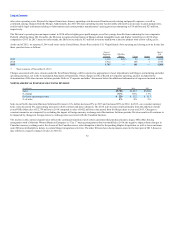
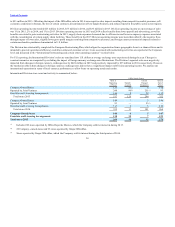
(In millions) 2014 2013
Sales $6,013 $3,580
% change 68% 11%
Division operating income $ 232 $ 113
% of sales 4% 3%
Sales in our North American Business Solutions Division in U.S. dollars decreased 5% in 2015 and increased 68% in 2014. In 2015, on a constant currency
basis, sales decreased 4%, representing decreases in both contract and direct channels. The 2014 sales increase results primarily from the addition of a full
year of OfficeMax sales of $2,759 million in 2014 compared to sales of $422 million in the period from the Merger date to year-end 2013. Changes in
constant currencies are computed by excluding the impact of foreign currency exchange rates fluctuations. In future periods, Division results will continue to
be impacted by changes in foreign currency exchange rates associated with the Canadian business.
The decline in the contract channel sales reflects the continued transition out of certain customers that purchased under a legacy OfficeMax buying
arrangement with a Minority Women Business Enterprise (a “Tier 1” buying arrangement) that was modified in 2014, the negative impacts from changes in
Canadian currency exchange rates, the closure of the Canadian stores, sales disruption related to the pending Staples Acquisition, as well as lower customer
order fill rates attributable to delays in certain Merger integration activities. The order fill rates have shown improvement in the later part of 2015, however,
may still have a negative impact on sales in 2016. In
32
(1)
(1)