OfficeMax 2015 Annual Report Download - page 32
Download and view the complete annual report
Please find page 32 of the 2015 OfficeMax annual report below. You can navigate through the pages in the report by either clicking on the pages listed below, or by using the keyword search tool below to find specific information within the annual report.-
 1
1 -
2
-
3
-
4
-
5
-
6
-
7
-
8
-
9
-
10
-
11
-
12
-
13
-
14
-
15
-
16
-
17
-
18
-
19
-
20
-
21
-
 22
22 -
 23
23 -
 24
24 -
 25
25 -
 26
26 -
 27
27 -
 28
28 -
 29
29 -
 30
30 -
 31
31 -
 32
32 -
 33
33 -
 34
34 -
 35
35 -
 36
36 -
 37
37 -
 38
38 -
 39
39 -
 40
40 -
 41
41 -
 42
42 -
43
-
44
-
45
-
46
-
47
-
48
-
49
-
50
-
51
-
52
-
53
-
54
-
55
-
56
-
57
-
58
-
59
-
60
-
61
-
62
-
63
-
64
-
65
-
66
-
67
-
68
-
69
-
70
-
71
-
72
-
73
-
74
-
75
-
76
-
77
-
78
-
79
-
80
-
81
-
82
-
83
-
84
-
85
-
86
-
87
-
88
-
89
-
90
-
91
-
92
-
93
-
94
-
95
-
96
-
97
-
98
-
99
-
100
-
101
-
102
-
103
-
104
-
105
-
106
-
107
-
108
-
109
-
110
-
111
-
112
-
113
-
114
-
115
-
116
-
117
-
118
-
119
-
120
-
121
-
122
-
123
-
124
-
125
-
126
-
127
-
128
-
129
-
130
-
131
-
132
-
133
-
134
-
135
-
136
 |
 |

Table of Contents
• Since the Merger date, we have made significant progress on our integration activities and implementing our Real Estate Strategy. In the United States, we
closed 168 and 181 retail stores in 2014 and 2015, respectively, converted all stores to common point of sale systems, completed certain warehouse cross-
banner consolidations, closures, and platform modifications, successfully launched the co-branded website (www.officedepot.com), combined operating
support functions, transitioned certain customers from the OfficeMax to the Office Depot platform, and made significant progress on identifying customer
preferences and developing methods to service their needs. Integration activities will continue in 2016 and certain supply chain activities are currently
anticipated to be substantially completed by the end of 2017.
Other Significant Factors Impacting Total Company Results and Liquidity
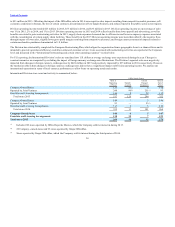
• Gross margin increased 75 basis points in 2015 compared to 2014, following a 10 basis point increase in the prior year to year comparison. Gross margin
in the North American Retail Division increased, while the North American Business Solution Division’s remained flat and the International Division’s
slightly decreased. Grupo OfficeMax has been omitted from basis point calculations.
• Total Company Selling, general and administrative expenses decreased in 2015 compared to 2014, reflecting the closure of stores in North America, lower
payroll and advertising expenses, operational efficiencies and synergies, the 2014 sale of the business in Mexico, and foreign currency translation effects.
As a percentage of sales, total Company Selling, general and administrative expenses decreased in 2015 compared to 2014 by over 60 basis points.
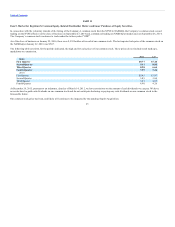
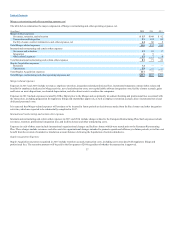
• Non-cash asset impairment charges of $13 million and $88 million were recorded in 2015 and 2014, respectively, and are comprised as follows.
(In millions) 2014
North America stores $ 25
Software implementation project 28
Software 25
Intangible assets 10
Total Asset impairments $ 88
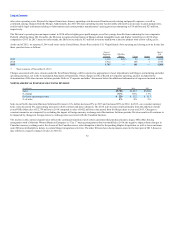
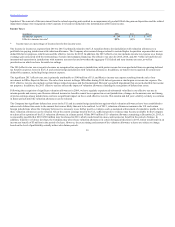
• We incurred $332 million and $403 million of Merger, restructuring, and other operating expenses, net in 2015 and 2014, respectively. In 2015, this line
item includes $140 million of expenses related to the Merger activities, including store closure costs incurred to date, $81 million of International
restructuring and certain other expenses, and $111 million of Staples Acquisition expenses.
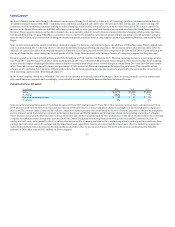
• The effective tax rate for 2015 was 83%, primarily caused by the net impact of not recognizing deferred tax benefits for pretax losses in certain tax
jurisdictions with valuation allowances, and the recognition of income tax expense in tax jurisdictions with pretax earnings. Because of the valuation
allowances and changes in the mix of earnings among jurisdictions and during interim periods, the Company continues to experience significant effective
tax rate volatility within the year and across years. Given the current earnings trend in the U.S., sufficient positive evidence may become available for the
Company to release all or a portion of the U.S. valuation allowance in a future period. Of the $493 million U.S. valuation allowance remaining at
December 26, 2015, it is reasonably possible that $265-$360 million may be released in 2016, which would result in a non-cash income tax benefit in the
period of release. However, the exact timing and amount of the valuation allowance releases are subject to change based on the level of profitability
actually achieved in future periods.
• The earnings (loss) per share was $0.01 in 2015 compared to $(0.66) in 2014. Earnings (loss) per share in both periods were negatively impacted by
Merger, restructuring, and other operating expenses and Asset impairments. The 2014 results were also negatively impacted by a Legal accrual of $81
million.
30