OfficeMax 2015 Annual Report Download - page 100
Download and view the complete annual report
Please find page 100 of the 2015 OfficeMax annual report below. You can navigate through the pages in the report by either clicking on the pages listed below, or by using the keyword search tool below to find specific information within the annual report.-
 1
1 -
2
-
3
-
4
-
5
-
6
-
7
-
8
-
9
-
10
-
11
-
12
-
13
-
14
-
15
-
16
-
17
-
18
-
19
-
20
-
21
-
22
-
23
-
24
-
25
-
26
-
27
-
28
-
29
-
30
-
31
-
32
-
33
-
34
-
35
-
36
-
37
-
38
-
39
-
40
-
41
-
42
-
43
-
44
-
45
-
46
-
47
-
48
-
49
-
50
-
51
-
52
-
53
-
54
-
55
-
56
-
57
-
58
-
59
-
60
-
61
-
62
-
63
-
64
-
65
-
66
-
67
-
68
-
69
-
70
-
71
-
72
-
73
-
74
-
75
-
76
-
77
-
78
-
79
-
80
-
81
-
82
-
83
-
84
-
85
-
86
-
87
-
88
-
89
-
 90
90 -
 91
91 -
 92
92 -
 93
93 -
 94
94 -
 95
95 -
 96
96 -
 97
97 -
 98
98 -
 99
99 -
 100
100 -
 101
101 -
 102
102 -
 103
103 -
 104
104 -
 105
105 -
 106
106 -
 107
107 -
 108
108 -
 109
109 -
 110
110 -
111
-
112
-
113
-
114
-
115
-
116
-
117
-
118
-
119
-
120
-
121
-
122
-
123
-
124
-
125
-
126
-
127
-
128
-
129
-
130
-
131
-
132
-
133
-
134
-
135
-
136
 |
 |

Table of Contents
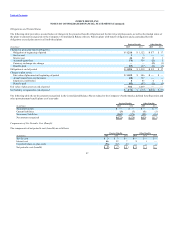
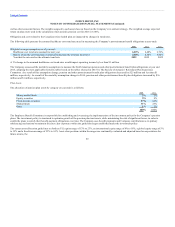
Other changes in plan assets and benefit obligations recognized in other comprehensive loss (income) are as follows:
(In millions) 2014 2013 2014 2013
Accumulated other comprehensive loss (income) at beginning of year $(26) $ — $— $—
Net loss (gain) 93 (26) 1 —
Accumulated other comprehensive loss (income) at end of year $ 67 $(26) $ 1 $—
Less than $1 million of the accumulated other comprehensive loss is expected to be recognized as components of net periodic cost during 2016.
Accumulated other comprehensive loss (income) as of year-ends 2014 and 2015 consist of net losses (gains).
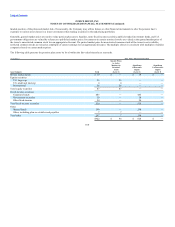
Assumptions
The assumptions used in accounting for the Company’s plans are estimates of factors including, among other things, the amount and timing of future benefit
payments. The following table presents the key weighted average assumptions used in the measurement of the Company’s benefit obligations as of year-
ends:
2014 2013 2014 2013 2014 2013
Discount rate 3.91% 4.84% 3.40% 4.00% 4.00% 4.80%
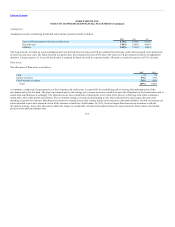
The following table presents the weighted average assumptions used in the measurement of net periodic benefit:
2014 2013 2014 2013 2014 2013
Discount rate 4.84% 4.76% 4.00% 3.80% 4.80% 4.60%
Expected long-term rate of return on plan assets 6.50% 6.60% —% —% —% —%
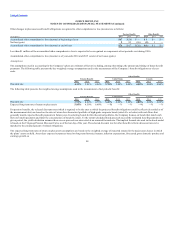
For pension benefits, the selected discount rates (which is required to be the rates at which the projected benefit obligations could be effectively settled as of
the measurement date) are based on the rates of return for a theoretical portfolio of high-grade corporate bonds (rated AA- or better) with cash flows that
generally match expected benefit payments in future years. In selecting bonds for this theoretical portfolio, the Company focuses on bonds that match cash
flows to benefit payments and limit the concentration of bonds by issuer. To the extent scheduled bond proceeds exceed the estimated benefit payments in a
given period; the yield calculation assumes those excess proceeds are reinvested at an assumed forward rate. The implied forward rate used in the bond model
is based on the Citigroup Pension Discount Curve as of the last day of the year. The selected discount rate for other benefits is from a discount rate curve
matched to the assumed payout of related obligations.
The expected long-term rates of return on plan assets assumptions are based on the weighted average of expected returns for the major asset classes in which
the plans’ assets are held. Asset-class expected returns are based on long-term historical returns, inflation expectations, forecasted gross domestic product and
earnings growth, as
98