OfficeMax 2015 Annual Report Download - page 108
Download and view the complete annual report
Please find page 108 of the 2015 OfficeMax annual report below. You can navigate through the pages in the report by either clicking on the pages listed below, or by using the keyword search tool below to find specific information within the annual report.-
 1
1 -
2
-
3
-
4
-
5
-
6
-
7
-
8
-
9
-
10
-
11
-
12
-
13
-
14
-
15
-
16
-
17
-
18
-
19
-
20
-
21
-
22
-
23
-
24
-
25
-
26
-
27
-
28
-
29
-
30
-
31
-
32
-
33
-
34
-
35
-
36
-
37
-
38
-
39
-
40
-
41
-
42
-
43
-
44
-
45
-
46
-
47
-
48
-
49
-
50
-
51
-
52
-
53
-
54
-
55
-
56
-
57
-
58
-
59
-
60
-
61
-
62
-
63
-
64
-
65
-
66
-
67
-
68
-
69
-
70
-
71
-
72
-
73
-
74
-
75
-
76
-
77
-
78
-
79
-
80
-
81
-
82
-
83
-
84
-
85
-
86
-
87
-
88
-
89
-
90
-
91
-
92
-
93
-
94
-
95
-
96
-
97
-
 98
98 -
 99
99 -
 100
100 -
 101
101 -
 102
102 -
 103
103 -
 104
104 -
 105
105 -
 106
106 -
 107
107 -
 108
108 -
 109
109 -
 110
110 -
 111
111 -
 112
112 -
 113
113 -
 114
114 -
 115
115 -
 116
116 -
 117
117 -
 118
118 -
119
-
120
-
121
-
122
-
123
-
124
-
125
-
126
-
127
-
128
-
129
-
130
-
131
-
132
-
133
-
134
-
135
-
136
 |
 |

Table of Contents
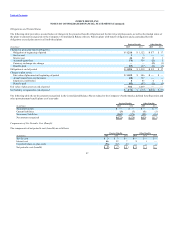
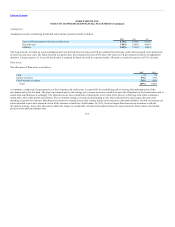
The following table presents the calculation of net loss per common share — basic and diluted:
(In millions, except per share amounts) 2014 2013
Numerator:
Net income (loss) attributable to common stockholders $ (354) $ (93)
Denominator:
Weighted-average shares outstanding 535 318
Basic earnings (loss) per share $(0.66) $(0.29)
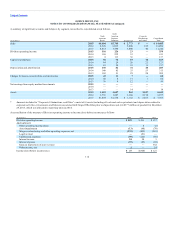
Numerator:
Net income (loss) attributable to Office Depot, Inc. $ (354) $ (20)
Denominator:
Weighted-average shares outstanding 535 318
Effect of dilutive securities:
Stock options and restricted stock — —
Diluted weighted-average shares outstanding 535 318
Diluted earnings (loss) per share $(0.66) $(0.29)
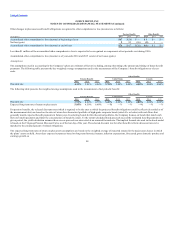
The following potentially dilutive stock options and restricted stock were excluded from the diluted loss per share calculation because of the net loss in the
periods.
(In millions) 2014 2013
Potentially dilutive securities:
Stock options and restricted stock — 8 7
Redeemable preferred stock — — 56
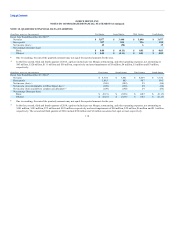
Awards of options and nonvested shares representing an additional 4 million, 9 million and 6 million shares of common stock were outstanding for the years
ended December 26, 2015, December 27, 2014, and December 28, 2013, respectively, but were not included in the computation of diluted weighted-average
shares outstanding because their effect would have been antidilutive. For the three years presented, no tax benefits have been assumed in the weighted
average share calculation in jurisdictions with valuation allowances.
Shares of the redeemable preferred stock were fully redeemed in 2013. In periods in which the redeemable preferred stocks were outstanding, basic earnings
(loss) per share (“EPS”) was computed after consideration of preferred stock dividends. The redeemable preferred stock had equal dividend participation
rights with common stock that required application of the two-class method for computing earnings per share. The preferred stockholders were not required to
fund losses.
106