NetSpend 2012 Annual Report Download - page 64
Download and view the complete annual report
Please find page 64 of the 2012 NetSpend annual report below. You can navigate through the pages in the report by either clicking on the pages listed below, or by using the keyword search tool below to find specific information within the annual report.-
 1
1 -
2
-
3
-
4
-
5
-
6
-
7
-
8
-
9
-
10
-
11
-
12
-
13
-
14
-
15
-
16
-
17
-
18
-
19
-
20
-
21
-
22
-
23
-
24
-
25
-
26
-
27
-
28
-
29
-
30
-
31
-
32
-
33
-
34
-
35
-
36
-
37
-
38
-
39
-
40
-
41
-
42
-
43
-
44
-
45
-
46
-
47
-
48
-
49
-
50
-
51
-
52
-
53
-
 54
54 -
 55
55 -
 56
56 -
 57
57 -
 58
58 -
 59
59 -
 60
60 -
 61
61 -
 62
62 -
 63
63 -
 64
64 -
 65
65 -
 66
66 -
 67
67 -
 68
68 -
 69
69 -
 70
70 -
 71
71 -
 72
72 -
 73
73 -
 74
74 -
75
-
76
 |
 |

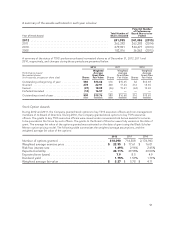
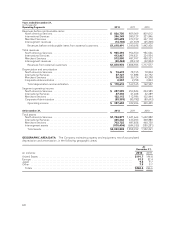
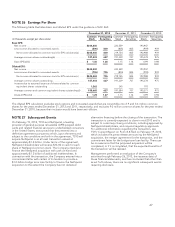
The following geographic area data represents revenues for the years ended December 31 based on the
domicile of the Company’s customers:
(in millions) 2012 % 2011 % 2010 %
United States .................................. $1,219.9 65.2 $1,227.8 67.9 $1,204.4 70.1
Europe ........................................ 293.0 15.7 283.5 15.7 250.2 14.6
Canada ....................................... 217.5 11.6 171.5 9.5 161.9 9.4
Japan ......................................... 78.6 4.2 76.3 4.2 61.3 3.6
Mexico ........................................ 11.7 0.6 7.8 0.4 7.9 0.5
Other ......................................... 50.3 2.7 42.1 2.3 31.9 1.8
Totals ....................................... $1,871.0 100.0 $1,809.0 100.0 $1,717.6 100.0
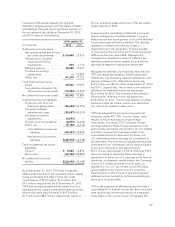
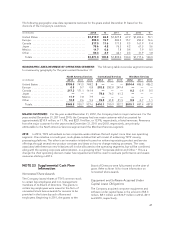
GEOGRAPHIC AREA REVENUE BY OPERATING SEGMENT: The following table reconciles segment revenue
to revenues by geography for the years ended December 31:
North America Services International Services Merchant Services
(in millions) 2012 2011 2010 2012 2011 2010 2012 2011 2010
United States .................. $705.5 741.5 748.2 $— ——$514.4 486.3 456.2
Europe ....................... 0.8 0.7 0.8 292.2 282.8 249.4 ———
Canada ....................... 217.3 171.1 161.4 ——— 0.2 0.4 0.5
Japan ........................ ———78.6 76.3 61.3 ———
Mexico ....................... 11.7 7.8 7.9 ——— ———
Other ......................... 10.5 9.6 9.3 39.3 31.8 21.5 0.5 0.7 1.1
Totals ....................... $945.8 930.7 927.6 $410.1 390.9 332.2 $515.1 487.4 457.8
MAJOR CUSTOMER: For the year ended December 31, 2012, the Company had no major customers. For the
years ended December 31, 2011 and 2010, the Company had one major customer which accounted for
approximately $210.9 million, or 11.7%, and $221.0 million, or 12.9%, respectively, of total revenues. Revenues
from the major customer for the years ended December 31, 2011 and 2010, respectively, are primarily
attributable to the North America Services segment and the Merchant Services segment.
2013: In 2013, TSYS will embark on two corporate-wide initiatives that will impact more than one operating
segment. One initiative is a multi-year, multi-phase initiative that will consist of enhancing TSYS’ issuing
processing platforms. The other is an innovation initiative focused on enhancing existing product and service
offerings through several new product concepts and ideas on how to change existing processes. The costs
associated with these two new initiatives will not be allocated to the operating segments, but will be combined,
along with the existing corporate administration, in a grouping titled “Corporate Admin and Other.” This is a
change the chief operating decision maker has requested and will be used to evaluate performance and assess
resources starting in 2013.
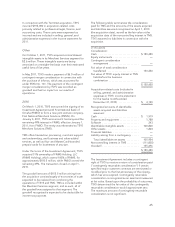
NOTE 23 Supplemental Cash Flow
Information
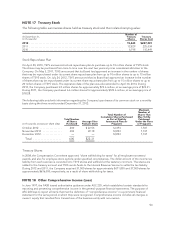
Nonvested Share Awards
The Company issued shares of TSYS common stock
to certain key employees and non-management
members of its Board of Directors. The grants to
certain key employees were issued in the form of
nonvested stock bonus awards for services to be
provided in the future by such officers and
employees. Beginning in 2011, the grants to the
Board of Directors were fully vested on the date of
grant. Refer to Note 16 for more information on
nonvested share awards.
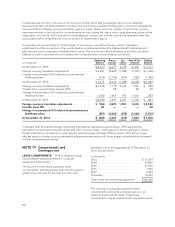
Equipment and Software Acquired Under
Capital Lease Obligations
The Company acquired computer equipment and
software under capital lease in the amount of $5.3
million, $8.1 million and $14.9 million in 2012, 2011
and 2010, respectively.
61