NetSpend 2012 Annual Report Download - page 18
Download and view the complete annual report
Please find page 18 of the 2012 NetSpend annual report below. You can navigate through the pages in the report by either clicking on the pages listed below, or by using the keyword search tool below to find specific information within the annual report.-
 1
1 -
2
-
3
-
4
-
5
-
6
-
7
-
 8
8 -
 9
9 -
 10
10 -
 11
11 -
 12
12 -
 13
13 -
 14
14 -
 15
15 -
 16
16 -
 17
17 -
 18
18 -
 19
19 -
 20
20 -
 21
21 -
 22
22 -
 23
23 -
 24
24 -
 25
25 -
 26
26 -
 27
27 -
 28
28 -
29
-
30
-
31
-
32
-
33
-
34
-
35
-
36
-
37
-
38
-
39
-
40
-
41
-
42
-
43
-
44
-
45
-
46
-
47
-
48
-
49
-
50
-
51
-
52
-
53
-
54
-
55
-
56
-
57
-
58
-
59
-
60
-
61
-
62
-
63
-
64
-
65
-
66
-
67
-
68
-
69
-
70
-
71
-
72
-
73
-
74
-
75
-
76
 |
 |

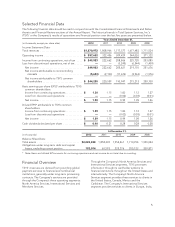
foreign currency translation, and $14.8 million of lost
business. The $59.8 million increase in segment total
revenues for 2011, as compared to 2010, is
attributable to a $43.2 million increase in new
business and organic growth and a $16.8 million
increase related to the impact of foreign currency
translation, which is partially offset by lost business.
The segment revenues for 2011 also included a
deconversion fee received from a client for the
discontinuance of an account portfolio.
TSYS terminated its Japan Gift Card program in
February 2013 due to negative future cash flows
resulting from the loss of two of the Gift Card
program’s major customers. The program’s negative
future cash flows indicated that the carrying value of
its assets would not be recovered. As a result, a
provision for the program’s future losses was made
and its assets were written down to zero.
Movements in foreign currency exchange rates as
compared to the U.S. dollar can result in foreign
denominated financial statements being translated
into fewer U.S. dollars, which impact the comparison
to prior periods when the U.S. dollar was weaker. For
2013, TSYS does not expect any significant
movements from the rates that existed at
December 31, 2012.
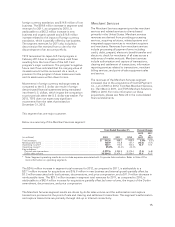
Merchant Services
The Merchant Services segment provides merchant
services and related services to clients based
primarily in the United States. Merchant services
revenues are derived from providing processing
services, acquiring solutions, related systems and
integrated support services to merchant acquirers
and merchants. Revenues from merchant services
include processing all payment forms including
credit, debit, prepaid, electronic benefit transfer and
electronic check for merchants of all sizes across a
wide array of market verticals. Merchant services
include authorization and capture of transactions;
clearing and settlement of transactions; information
reporting services related to transactions; merchant
billing services; and point-of-sale equipment sales
and service.
The revenues of the Merchant Services segment
increased due to the acquisitions of Central Payment
Co., LLC (CPAY) in 2012, TermNet Merchant Services,
Inc. (TermNet) in 2011, and TSYS Merchant Solutions
(TMS) in 2010. For more information on these
acquisitions, please see Note 24 in the consolidated
financial statements.
This segment has one major customer.
Below is a summary of the Merchant Services segment:
Years Ended December 31, Percent Change
(in millions) 2012 2011 2010
2012
vs.
2011
2011
vs.
2010
Total revenues ..................................................... $ 512.6 488.0 458.9 5.0% 6.3%
Reimbursable items ................................................. 102.9 114.8 121.7 (10.4) (5.7)
Operating income* .................................................. 132.1 113.0 102.4 16.9 10.3
Operating margin* .................................................. 25.8% 23.2% 22.3%
Key indicators:
Point-of-sale transactions ........................................... 4,877.6 4,955.5 5,315.4 (1.6) (6.8)
Dollar sales volume ................................................ 38,864.2 33,674.2 23,556.4 15.4 43.0
* Note: Segment operating results do not include expenses associated with Corporate Administration. Refer to Note 22 for
more information on operating segments.
The $24.6 million increase in segment total revenues for 2012, as compared to 2011, is attributable to a
$27.1 million increase for acquisitions and $16.9 million in new business and internal growth partially offset by
$7.3 million associated with lost business, deconversions, and price compression, and a $11.9 million decrease in
reimbursable items. The $29.1 million increase in segment total revenues for 2011, as compared to 2010, is
attributable to a $42.4 million increase for acquisitions partially offset by lower volume, the impact of the Durbin
amendment, deconversions, and price compression.
The Merchant Services segment results are driven by dollar sales volume and the authorization and capture
transactions processed at the point-of-sale and clearing and settlement transactions. This segment’s authorization
and capture transactions are primarily through dial-up or Internet connectivity.
15