NetSpend 2012 Annual Report Download - page 29
Download and view the complete annual report
Please find page 29 of the 2012 NetSpend annual report below. You can navigate through the pages in the report by either clicking on the pages listed below, or by using the keyword search tool below to find specific information within the annual report.-
 1
1 -
2
-
3
-
4
-
5
-
6
-
7
-
8
-
9
-
10
-
11
-
12
-
13
-
14
-
15
-
16
-
17
-
18
-
 19
19 -
 20
20 -
 21
21 -
 22
22 -
 23
23 -
 24
24 -
 25
25 -
 26
26 -
 27
27 -
 28
28 -
 29
29 -
 30
30 -
 31
31 -
 32
32 -
 33
33 -
 34
34 -
 35
35 -
 36
36 -
 37
37 -
 38
38 -
 39
39 -
40
-
41
-
42
-
43
-
44
-
45
-
46
-
47
-
48
-
49
-
50
-
51
-
52
-
53
-
54
-
55
-
56
-
57
-
58
-
59
-
60
-
61
-
62
-
63
-
64
-
65
-
66
-
67
-
68
-
69
-
70
-
71
-
72
-
73
-
74
-
75
-
76
 |
 |

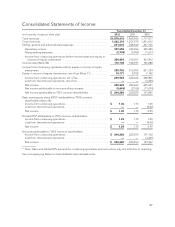
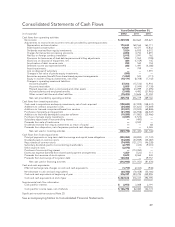
Consolidated Balance Sheets
December 31,
(in thousands, except per share data) 2012 2011
Assets
Current assets:
Cash and cash equivalents (Note 5) ......................................... $ 247,612 316,337
Accounts receivable, net of allowance for doubtful accounts and billing adjustments
of $3.9 million and $4.1 million at 2012 and 2011, respectively ................ 247,083 248,541
Deferred income tax assets (Note 20) ....................................... 9,825 12,872
Prepaid expenses and other current assets (Note 6) ............................ 70,206 72,431
Total current assets ..................................................... 574,726 650,181
Goodwill (Note 10) ......................................................... 518,344 355,498
Property and equipment, net of accumulated depreciation and amortization
(Note 7) ................................................................ 260,389 266,608
Computer software, net of accumulated amortization (Note 8) ..................... 226,917 215,244
Contract acquisition costs, net of accumulated amortization (Note 9) ............... 161,267 162,987
Other intangible assets, net of accumulated amortization (Note 12) ................ 130,054 81,250
Equity investments (Note 11) ................................................ 87,764 82,924
Deferred income tax assets (Note 20) ......................................... 5,334 4,069
Other assets .............................................................. 59,043 39,631
Total assets ........................................................... $2,023,838 1,858,392
Liabilities
Current liabilities:
Accounts payable ........................................................ $ 63,370 26,095
Accrued salaries and employee benefits ..................................... 26,243 33,004
Current portion of long-term debt (Note 13) .................................. 27,361 181,251
Current portion of obligations under capital leases (Note 13) .................... 13,263 14,363
Other current liabilities (Note 14) ........................................... 100,282 125,863
Total current liabilities .................................................. 230,519 380,576
Long-term debt, excluding current portion (Note 13) ............................ 174,859 39,104
Deferred income tax liabilities (Note 20) ....................................... 48,074 32,889
Obligations under capital leases, excluding current portion (Note 13) ............... 17,155 24,489
Other long-term liabilities ................................................... 68,791 60,325
Total liabilities ......................................................... 539,398 537,383
Redeemable noncontrolling interest ......................................... 39,505 —
Equity
Shareholders’ equity (Notes 15, 16, 17 and 18):
Common stock — $0.10 par value. Authorized 600,000 shares; 202,471 and 201,860
issued at 2012 and 2011, respectively; 187,031 and 189,031 outstanding at 2012
and 2011, respectively .................................................. 20,247 20,186
Additional paid-in capital .................................................. 141,793 125,948
Accumulated other comprehensive income(loss), net ........................... 1,408 (445)
Treasury stock (shares of 15,440 and 12,829 at 2012 and 2011, respectively) ....... (287,301) (225,034)
Retained earnings ........................................................ 1,549,063 1,380,634
Total shareholders’ equity ............................................... 1,425,210 1,301,289
Noncontrolling interests in consolidated subsidiaries ............................. 19,725 19,720
Total equity ........................................................... 1,444,935 1,321,009
Commitments and contingencies (Note 19)
Total liabilities and equity ............................................... $2,023,838 1,858,392
See accompanying Notes to Consolidated Financial Statements
26