NetSpend 2012 Annual Report Download - page 54
Download and view the complete annual report
Please find page 54 of the 2012 NetSpend annual report below. You can navigate through the pages in the report by either clicking on the pages listed below, or by using the keyword search tool below to find specific information within the annual report.-
 1
1 -
2
-
3
-
4
-
5
-
6
-
7
-
8
-
9
-
10
-
11
-
12
-
13
-
14
-
15
-
16
-
17
-
18
-
19
-
20
-
21
-
22
-
23
-
24
-
25
-
26
-
27
-
28
-
29
-
30
-
31
-
32
-
33
-
34
-
35
-
36
-
37
-
38
-
39
-
40
-
41
-
42
-
43
-
 44
44 -
 45
45 -
 46
46 -
 47
47 -
 48
48 -
 49
49 -
 50
50 -
 51
51 -
 52
52 -
 53
53 -
 54
54 -
 55
55 -
 56
56 -
 57
57 -
 58
58 -
 59
59 -
 60
60 -
 61
61 -
 62
62 -
 63
63 -
 64
64 -
65
-
66
-
67
-
68
-
69
-
70
-
71
-
72
-
73
-
74
-
75
-
76
 |
 |

A summary of the awards authorized in each year is below:
Year of Initial Award Total Number of
Shares Awarded
Potential Number
of Performance-
Based Shares to be
Vested
2012 ................................................... 241,095 241,096 (2015)
2011 .................................................... 263,292 263,292 (2014)
2010 .................................................... 279,831 534,477 (2013)
2008 .................................................... 182,816 36,562 (2013)
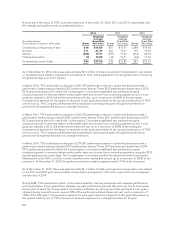
A summary of the status of TSYS’ performance-based nonvested shares as of December 31, 2012, 2011 and
2010, respectively, and changes during those periods are presented below:
2012 2011 2010
Performance-based
Nonvested shares
(in thousands, except per share data) Shares
Weighted
Average
Grant Date
Fair Value Shares
Weighted
Average
Grant-Date
Fair Value Shares
Weighted
Average
Grant-Date
Fair Value
Outstanding at beginning of year ............. 580 $16.68 316 $15.65 62 $13.69
Granted .................................. 278 22.91 300 17.63 316 15.65
Vested .................................... (37) 18.08 (36) 15.61 (62) 13.69
Forfeited/canceled ......................... (12) 16.57 ————
Outstanding at end of year ................... 809 $18.76 580 $16.68 316 $15.65
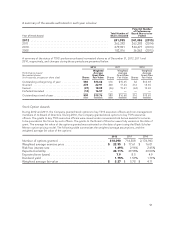
Stock Option Awards
During 2012 and 2011, the Company granted stock options to key TSYS executive officers and non-management
members of its Board of Directors. During 2010, the Company granted stock options to key TSYS executive
officers. The grants to key TSYS executive officers were issued under nonvested stock bonus awards for services
to be provided in the future by such officers. The grants to the Board of Directors were fully vested on the date of
grant. The average fair value of the options granted was estimated on the date of grant using the Black-Scholes-
Merton option-pricing model. The following table summarizes the weighted average assumptions, and the
weighted average fair value of the options:
2012 2011 2010
Number of options granted ............................... 818,090 716,508 2,176,963
Weighted average exercise price ........................... $ 22.95 $ 17.61 $ 16.01
Risk-free interest rate .................................... 1.69% 2.96% 2.65%
Expected volatility ....................................... 24.11% 29.98% 30.00%
Expected term (years) .................................... 7.9 8.5 4.9
Dividend yield .......................................... 1.75% 1.59% 1.79%
Weighted average fair value ............................... $ 5.27 $ 5.78 $ 4.11
51